


- USD/INR has shown limited movement over the last five sessions, hovering near the 95.00 support with narrow daily ranges and low volatility overall
- The pattern signals consolidation as markets await clearer cues from dollar strength, RBI liquidity management, oil prices, and capital flows
- Oil price, US-India trade relations RBI and Federal Reserve comments and policy decisions hold key sway on the USD/INR forex pair's long and medium-term momentum
The US dollar gained over 0.4% against the Indian rupee in September, wiping out August’s roughly 0.2% decline when the rupee had seen some support. This shift came from both global and domestic factors.
According to a Bank of Baroda research note, the rupee depreciated by only about 0.8% in July, even as global crude oil prices surged more than 20% amid escalating tensions in the Middle East. For a currency as sensitive to oil as the rupee, that’s a genuinely soft landing.
The key factors behind this shift include macroeconomic changes, direct intervention from the Reserve Bank of India (RBI), and swings in global commodity markets.
Keep an eye on US economic news and any statements from the RBI, as these can change market feelings quickly. For now, the pair shows limited momentum and patience remains key while the market digests recent moves. Traders may find better opportunities once a clearer trend emerges.
This article was originally written in December 2024 and updated on September 14, 2026, to reflect recent developments, including Strait of Hormuz blockade, actions by RBI and Federal Reserve, and the impact of oil price spike. All technical levels and market commentary are based on the latest data available at the time of writing.
Oil Price, Foreign Investor Outflows Shape USD/INR Momentum
Crude oil prices are a big reason for the shift. Brent crude has approached and even surpassed $100 per barrel, driven by renewed Middle East tensions.
Since India relies heavily on energy imports, pricier oil means buying more dollars for payments, which weakens the rupee. This higher demand for dollars to cover oil costs has countered some of the support the rupee found in August.
Foreign portfolio investment has also changed. After a stable period, foreign investors sold Indian equities, which boosted dollar demand. Meanwhile, the broader US dollar market has held up quite well.
Even when the Dollar Index (DXY) showed little movement, expectations around US monetary policy kept the dollar strong against emerging market currencies.
USD/INR Outlook For the Third Quarter of 2026
Looking ahead to the third quarter, I expect the pair to trade within a fairly tight range. Most market participants expect it to stay between 94 and 97. We might even see it test the lower end of that range if oil prices drop more and capital flows pick up.
Over the next few weeks, the USD/INR pair will probably trade in a narrow range. The RBI stands ready to step in, and ongoing inflows as the special deposit window closes should keep the USD/INR from climbing sharply.
On the flip side, importer demand and the chance of a stronger dollar before the September Fed meeting will likely stop the rupee from gaining too much.
Traders will watch India’s economic growth data, U.S. employment figures, and oil prices for clues about the pair’s next move. If Brent crude prices keep falling or the Fed turns more dovish, the pair could see further small drops. But the reverse would likely bring back upward pressure.
The Reserve Bank of India’s (RBI) monetary policy will continue to influence the currency. The central bank is anticipated to maintain the repo rate at its early August review, keeping a neutral monetary stance while closely monitoring inflation.
Factors such as elevated oil prices and potential food price volatility due to monsoon patterns could contribute to sustained inflation, limiting the possibility of any interest rate cuts in the near term. The RBI’s capacity to intervene in the foreign exchange market, supported by robust foreign exchange reserves, is expected to help manage any sharp currency movements.
Global economic conditions will also play a role. De-escalation of tensions in the Middle East, or a weaker US dollar could benefit the Indian rupee. Conversely, increased geopolitical instability or stronger-than-expected economic data from the United States might support the dollar, leading to continued upward pressure on the USD/INR pair.
Impacts of Interest Rates
What the Reserve Bank of India (RBI) and the Federal Reserve are doing matters too. The RBI has been actively stepping into the foreign exchange market, using government-owned banks to sell dollars. The goal of these actions is to stop the rupee from dropping too much and to keep the market steady.
These interventions have often kept a lid on upward moves in the USD/INR, stopping the rupee from weakening much further. The RBI had also previously built up India’s external reserves by drawing in non-resident deposits. That gave policymakers more room to manage currency swings.
On the US monetary policy front, markets had anticipated Federal Reserve rate cuts in 2026. However, a more hawkish stance, including updated projections suggesting a potential rate hike by year-end rather than a cut, has kept US yields elevated and the dollar generally well-supported.
The Federal Reserve’s upcoming policy decision will likely influence the USD/INR’s near-term path more than any independent moves by the RBI.

When US yields are higher, the dollar usually gets stronger, and investments in emerging markets become less attractive. This puts more pressure on the rupee. The RBI’s careful approach to interest rates, combined with the Federal Reserve possibly tightening its own monetary policy, has helped the dollar gain ground lately.
The Risks Worth Watching
India is the world’s third-largest imported of crude oil, and the product’s price oscillations have a significant impact on the rupee. Dollar-denominated crude oil has experienced a slowdown in demand for the last year, as China’s economic growth declined.
The single biggest wildcard remains the unresolved US-India trade relationship. Tariffs on Indian products have made them less competitive abroad. Whether the two countries can agree on something to ease this is probably the most significant factor for the rupee’s performance over the next few years. If they reach a deal, it would strongly suggest the rupee will get stronger. If they don’t, the pressure on it will likely continue.
Oil is another clear risk. The conflict in the Middle East has calmed down a bit, with news of a US-Iran negotiation period and tanker traffic through the Strait of Hormuz slowly returning to normal. However, this could change fast if tensions rise again.
Foreign portfolio flows bring another layer of uncertainty. They’ve seen both heavy outflows and supportive inflows over the past year. Another round of selling in Indian stocks or bonds would quickly test the rupee’s current stability.
USD/INR Historical Chart
USD to INR trading dates back to 1973 when the pair was floated in the forex market at an opening price of $1 to 7.98 rupees. By late 1983, the currency pair rose past the psychological level of 10 rupees to the US Dollar. Between then and April 2002, it rallied by 376.41% to 48.76 rupees.
After retracing to 39.9 rupees in November 2007, the USD/INR has been on an uptrend since then. The pair surged to an all-time high of 95.23 in March 2026.
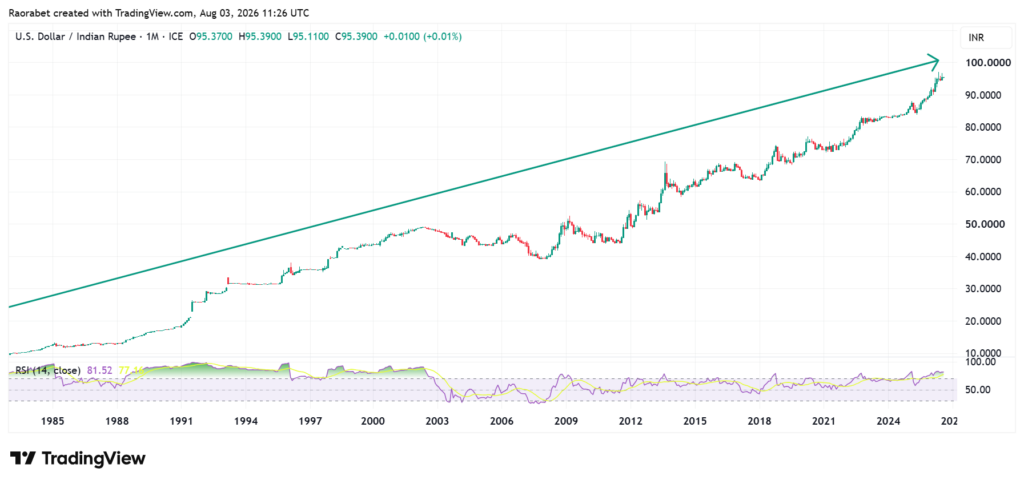
As the US Federal Reserve started to hike rates, Indian rupee started to slide against the US Dollar. In October 2022, the pair surged to a new all-time high of 83.28. This ATH was refreshed in 2023. However, the dollar’s rally in 2024 saw it hit a new ATH on March 22. That’s not all, the upward momentum strengthened through 2025 to peak at 91.05 in December. Rising oil prices and uncertainty in US-India trade relations have added fuel to the pair, pushing it to all-time highs of 96.97 seen in May 2026.
Medium-Term Outlook
During late July and into early August, continued strength in equities provided a buffer against significant declines in the rupee. Domestic institutional investors also played a role by purchasing assets, which helped absorb market fluctuations. This activity mitigated the impact of external pressures on the currency.
The recovery observed in the equity market contributed to a stabilizing effect, assisting the rupee in maintaining firmer positions around the 95.3–95.4 level. However, this positive development does not entirely resolve the challenges. Foreign portfolio investors (FPIs) have recorded net selling activity for the year overall. Year-to-date outflows have reached approximately ₹2.6 trillion.
Structural economic factors point to a gradual weakening of the rupee as of the end of August. India’s persistent trade deficit, heavy reliance on imported energy, and the eventual end of exceptional capital inflow programs mean dollar demand could pick up again once current reserves run low.
For instance, MUFG analysts expect USD/INR to reach the 94-95 range over the next few quarters, then possibly climb to 96 by 2027. Other forecasts see a rate closer to 97 by the end of fiscal year 2027, due to similar external economic imbalances.
USD/INR Quarterly Outlook: Rupee Faces Next Key Resistance At 96.00 in Q3
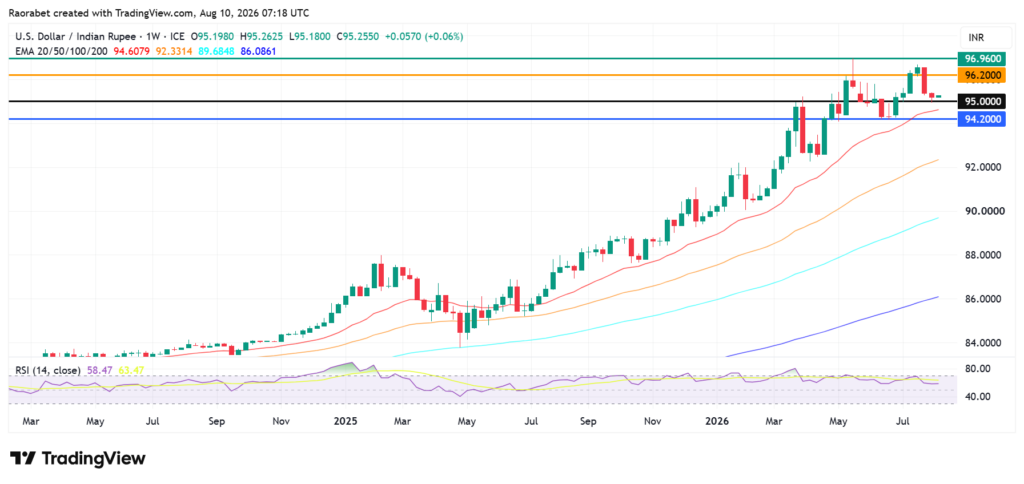
On the weekly chart, the USD/INR is trading close to 95.30. The overall trend remains upward, supported by its major long-term exponential moving averages.
The price is above the 20-week EMA, which is around 94.80. It’s also well above the 50-week EMA at about 93.50 and the 100-week EMA near 91.80.
This shows that the upward trend is still strong. The Relative Strength Index (RSI) is around 45–50, which suggests a neutral or balanced market sentiment, not showing signs of being overbought.
The main support level is at the 95.00 mark, which is a key psychological level and aligns with the 20-week EMA. After that, the next support is around 94.20, near the 50-week EMA. The key resistance is at 96.20, which is near the recent swing high. If it breaks that, the next resistance would be the all-time record high of 96.96
What will be USD to INR Rate in 2027?
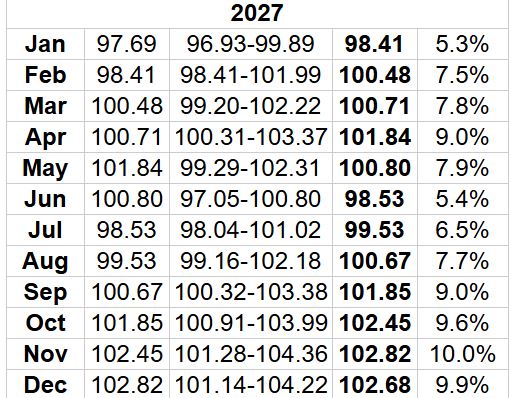
Long Forecast’s USD to INR forecast 2027 suggests the start of the year around 97.69 rupees. It expects the currency pair to average 98.53 by mid-year before rallying further to 102.82 by the end of the year. The prices can go much higher if the global economy enters a prolonged recession after the ongoing deflationary measures.
USD to INR Forecast 2030
A feasible USD to INR forecast for 2030 is informed by the economic health of India and the US, Fed and RBI’s monetary policy, and the demand for the US dollar as a safe haven. Hence, a strong dollar will likely push USD to INR to a new record high, depending on the key drivers.
However, as an emerging market, India’s currency has the potential to strengthen further in the coming years. From that perspective, USD to INR forecast 2030 will be for the pair to remain within a range for several years.
How to trade USDINR
To trade USDINR, one needs to open an account with a reputable forex broker. When researching the best broker, it is helpful to consider their spreads, commissions, and other fees. It is also possible to trade the currency’s derivatives in the form of USDINR futures.