


- The USD/INR has resumed its upside move, taking tout a critical resistance as Iran announces a new closure of the Strait of Hormuz.
Current Setup and Live Chart
The USD/INR is trading higher this Monday after renewed geopolitical tensions between the US and Iran took a new turn, with Iran announcing it would close the Strait of Hormuz once more on Sunday evening. The closure of the Strait of Hormuz has already affected oil prices, with Brent crude spiking to near $79 per barrel. The situation threatens to restart the oil-shock risk premium, which could significantly increase India’s energy import bills. India is a net energy importer, with most of its oil imports coming through the blockaded Strait of Hormuz. This makes the rupee sensitive to the blockade and the attendant increase in oil prices.
A sustained increase in Brent crude prices means India has to pay more rupees for higher oil (priced in US Dollars), widening the current account deficit. The Reserve Bank of India (RBI) typically acts to smooth volatility amid the rupee’s weakness, but the momentum has decidedly shifted back towards the US Dollar.
USD/INR Macro Drivers
1) Rising oil prices
Oil prices are up 2.84% this Monday, taking the rupee to 1-month lows as the renewed geopolitical escalation brings back the threat of elevated oil prices. Brent crude may not be close to $100 yet, but it could be if the blockage persists. Elevated oil prices increase the Indian government’s import payments for this product. Because oil is priced in US Dollars, higher oil prices mean more rupees are required to pay for higher USD-priced crude oil. There is also a higher risk of imported inflation and a wider current account deficit. Companies listed on the Indian exchange also face greater pressure on margins from higher fuel costs. This is how rising oil prices impact the USD/INR pair.
2) Safe-haven Demand
The escalation introduces global economic uncertainty. This leads to a flow of capital away from risk-associated assets and into defensive and safe-haven assets, such as the US Dollar. The US Dollar gains from safe-haven demand and is a global liquidity currency of preference. During this time, there is reduced appetite for emerging-market FX, which includes the rupee.
3) RBI intervention
The Reserve Bank of India typically intervenes to smooth price movements when volatility is excessive. Interventionist moves by the RBI include sales of more dollars from the country’s forex reserves, open market operations, and liquidity management measures. Interventions do not lead to trend reversals; they only cause retracements to support levels at best, or make uptrend moves more gradual rather than sharply overextended.

This Week’s Price Catalysts for the USD/INR
1) Developments in the Strait of Hormuz: For this week, this is the primary price catalyst for the USD/INR. The markets will be looking out for the state of oil shipping activity, the level of export disruptions, and developments on the military and diplomatic front. In other words, headlines around the Strait of Hormuz will be significant price catalysts for the pair. The rupee will benefit from greater diplomatic engagement, military de-escalation, and a lower scale of disruption to oil shipping than previously feared.
2) Brent crude prices: the day-to-day changes in oil prices will directly impact the rupee and the level of risk aversion in the global markets (the driver of safe-haven demand for the US Dollar). If oil prices keep rising, risk aversion will increase, leading to more capital outflows from Indian stocks, which will put more pressure on the rupee.
3) RBI communication and foreign portfolio flows: The markets will watch out for any interventions by the RBI that match the scale of the previous major intervention of three weeks ago, additional commentary from the apex bank, and data around the flows of foreign portfolio funds into and out of Indian equities and bonds.
USD/INR Weekly Forecast Scenarios
Base case: a bullish USD/INR, triggered by elevated crude oil prices, increased geopolitical uncertainty, and stronger-than-expected safe-haven demand for the greenback. RBI intervention is expected to moderate the pair’s uptick.
Bull case: strong bullishness on USD/INR will result from an extended closure of the Strait of Hormuz, to the point that oil prices start heading towards the $100 mark. This scenario will also see increased dollar demand as portfolio funds exit the Indian market and seek reconversion to the US Dollar as it seeks new destinations. We would also see a sharp rise in India’s energy import bills, requiring more rupees to pay for higher-priced, USD-denominated energy imports. This scenario also generates sustained risk aversion, which supports the US Dollar and harms emerging-market FX. A price of USD/INR 96.00 cannot be ruled out in this case.
Bear case: an unwinding of the risk premium via a rapid de-escalation of the conflict, the reopening of the blockaded Strait of Hormuz, and an accompanying oil price decline allow India’s import bills to drop. Furthermore, investor confidence in emerging-market currencies will be boosted, leading to a retracement in USD/INR towards recent support levels.
Takeaway
The USD/INR has shown itself to be one of the currency pairs that have direct exposure to the geopolitical conflict and the energy price complex. The pair’s direction is directly correlated with the escalation of the conflict and with oil prices.
USD/INR Technical Outlook
The double bottom on the trendline and the 94.04 61.8% Fibonacci retracement level of the 8 April – 20 May uptick led to a breach of the 95.24 resistance and former high of 30 March and 5 May. The break of this barrier has unlocked the pathway towards a reclaim of the 20 May high at 96.99. If this all-time high is exceeded, the uptrend is confirmed and the 98.23 resistance formed by the 27% Fibonacci extension level comes into view.
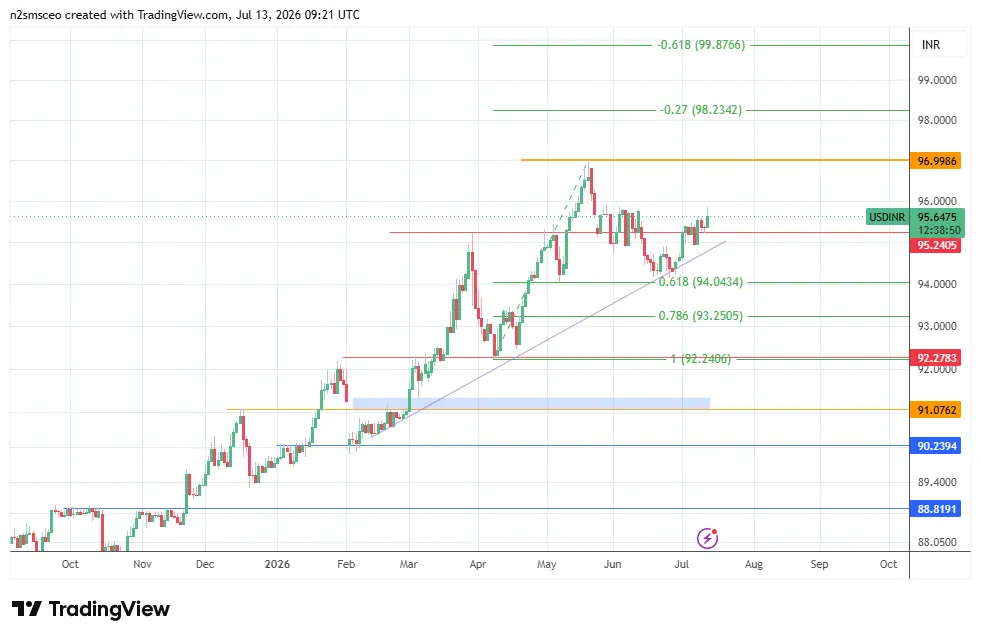
However, a breakdown of the 95.24 price level that now acts as a role-reversed support and the trendline confirms the retracement move, targeting a retest of the 94.04 support initially. If the bulls fail to defend this support, the 93.25 price mark and neckline of the 8 April/17 April double bottom comes into view. If the bears degrade this support, a new pivot lines up at 92.24, the 100% retracement and 8 April low.