



- The USD/INR now has a strong resistance at 96.00, site of what now looks like a defense zone for the Reserve Bank of India post-Fed.
Current Setup
Bias: Cautiously bullish USD/INR above 95.45.
Despite remaining structurally bullish, USD/INR weakened slightly this Friday after Brent crude fell to $103/barrel. The rupee had initially traded at a seven-week low around 96.10–96.20 following the Fed’s rate hike and a spike in oil prices to $109 in Monday’s Asian session. However, the markets are reassessing the Fed decision, and a pullback in US bond yields has allowed the pair to retreat toward 95.75–95.80. The pair has closed the week at 95.8630 per dollar, down about 0.3% for the week.
The key development is the formation of a defense zone for potential Reserve Bank of India interventions at 96.00. Reports indicate that India’s apex bank has intervened several times at this zone to prevent sharp, disorderly rupee depreciation.
Primary Drivers for the USD/INR
1. The Fed Hike
The Federal Reserve’s 16 September rate hike and hawkish dot plot added a fundamental tailwind to the US Dollar. The resultant rise in US Treasury yields has created dollar demand, which is a negative for emerging market FX. Watch the US Dollar Index as it responds to the rate hike.
2. INR is Vulnerable to Higher Oil Prices
India’s heavy dependence on energy imports renders the country and its currency vulnerable to higher prices. Higher crude prices raise India’s import costs and pressurize the trade balance. This week’s spike to $109 drove the rupee down to 96.00, while Friday’s drop to $103 provided modest relief for the INR.
3. RBI Intervention
Various reports indicate some level of RBI intervention at the 96.00 price level. Per Reuters, state-run banks are also selling USD, drawing attention to 96.00 as the key intervention point. This makes the area a key psychological resistance level.

USD/INR Forecast Scenarios
Base case→ Consolidation: The modest decline in USD/INR has placed it within the 95.40–96.10 range. The pair is expected to trade within this range as traders reassess the Fed dot plot and oil price direction.
Bull case→ Breakout: Price needs to clear 96.10 to indicate that the intervention barrier is no longer valid. This scenario is more likely if Brent crude retests the $110 price mark or rises above it, and US Treasury yields push back above 5.00%.
Bear case→Rupee recovery: if price maintains a sustained breakdown of 95.45 based on falling oil prices and declining US bond yields, rupee recovery could pick up pace towards 94.00.
An additional headwind comes from the new near-term capital inflows that will follow the listing of the fully subscribed $2.3 billion NSE IPO.
Near Term Price Catalysts
1. Brent crude: This remains the most important variable dictating the rupee’s value
2. US Treasury yields: A renewed push above the 5% mark makes a case for additional USD/INR strength.
3. RBI intervention: The 96.00 price level is now the key price mark to beat. If new demand overwhelms the aggressive dollar selling at this level, a further upside push ensues.
4. Indian monetary policy: Higher oil prices have brought about imported inflation, especially in a country which is heavily energy dependent like India. Markets are now pricing in the potential for an RBI rate hike after months of easing. Reuters indicates that traders have priced in an additional 80bps of RBI hikes over the next 12 months, starting in October. This is a developing situation to watch.
Technical Outlook
The 96.00 price level is now a key technical barrier. A break above this level unlocks access to the 96.50 resistance (24 July high). If the advance continues beyond this point, the 96.99 resistance becomes the next upside target.
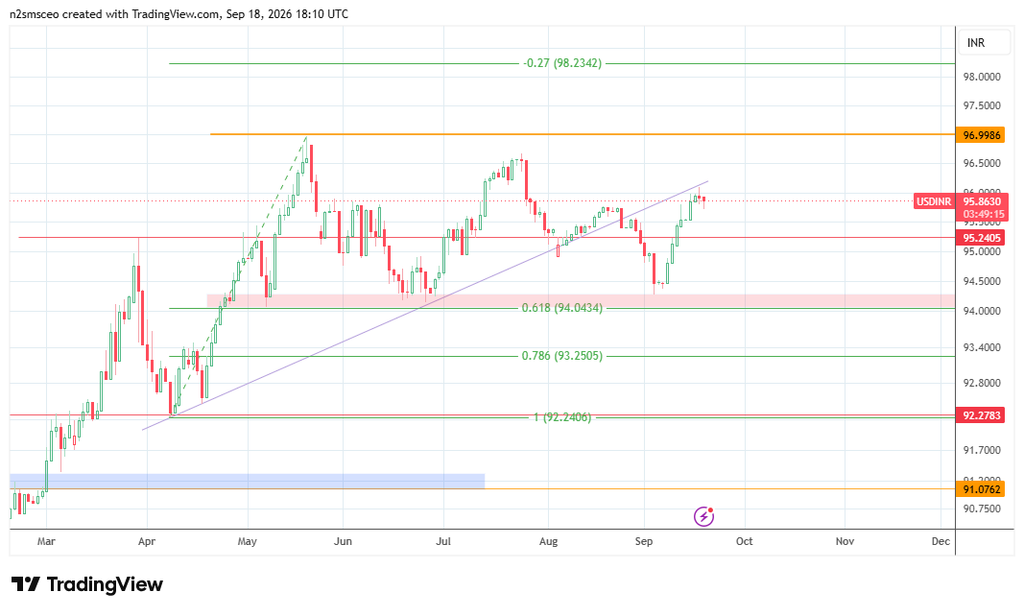
On the flip side, rejection at 96.00 will first test the 95.24 support. If the bulls fail to defend this barrier, the 94.29 upper boundary of the support zone around the 61.8% Fibonacci retracement of the 8 April to 20 May upswing becomes the next support target.