



- Investors on the Nasdaq 100 will decide whether to react to the Fed rate hike in stronger terms, or yield to AI earnings growth.
Current Setup and Live Chart
The Nasdaq 100 index recovered from its post-FOMC lows on Thursday as oil prices eased slightly, but hit resistance on Friday as markets continue to digest the Fed’s 25bps rate hike and hawkish dot plot. The hike to 3.75%–4.00% and the 4.1% dot plot for the rest of 2026 leave room for one more rate hike by year-end. This leaves the Nasdaq 100 with a cautiously bearish bias as long as price remains below the 29,300–29,500 price band. However, AI demand still has the capacity to mitigate any selloff due to the hawkish Fed stance.
Major Macro Driver: Aspects of the FOMC Rate Hike
1. For the Fed, Inflation is Still an Issue
The September statement notes that inflation remains elevated, leading the Fed to conclude that another 25-bp increase was appropriate. This is an important driver for the Nasdaq 100, as tech stocks are negatively affected by discounted future earnings and compressed valuation multiples that follow rising bond yields and rate hikes.
2. Hawkish Fed Dot Plot
The median Fed dot plot set the year-end 2026 Federal Funds Rate at 4.1%, implying one more 25-bp hike after 16 September 2026 before year-end. The median stays at 4.1% for 2027, ruling out any easing in 2027. MarketWatch reports that 16 of 18 Fed policymakers see the Fed Funds Rate hiked at least once more in 2026, which is in line with current projections.
3. Inflation Forecasts Revised Upwards
The Fed has revised its headline PCE price index forecast from 3.6% in June to 3.7% for 2026 and the core PCE from 3.3% to 3.4%. The path towards a 2% reading is now slower, limiting the scope for rapid easing.
4. Oil Prices
Brent crude has pulled back slightly, but still trades above $103 a barrel. This remains a factor contributing to inflationary concerns and reduces the chances of a Fed easing. Inflationary pressures from the spike in oil prices were partly responsible for the Fed’s hawkish actions. This leaves the Nasdaq 100 facing the triad of higher oil prices, higher inflation, and higher-for-longer rates, leading to lower valuations for its listed tech components.

What Matters Next
Investors will be focusing on:
- US Treasury yields — will the US 10-year Treasury yield stay above 5.00%, or will it fall below this critical point?
- Oil prices — The $100-$110 range is critical. Above $110, the Nasdaq 100 could suffer a selloff. Below $100 is Nasdaq-supportive.
- US inflation data — is core inflation accelerating or cooling? This determines if we have more than one hike or no more hikes by year-end.
- AI/semiconductor earnings — strong earnings growth offsets any pressures on tech stock valuations from the recent Fed hike.
- October FOMC expectations — the markets are already pricing in an October Fed rate hike. Inflation data and oil prices will be key as the Fed adopts a data-dependent approach.
Nasdaq 100: Forecast Scenarios
Base case→ Consolidation/bearish bias: The index currently trades in a two-way consolidation as markets decide whether to reprice the Nasdaq 100 following the FOMC decision or lean toward AI demand, which could extend well into 2028.
Bull case→ Hawkish Fed: Stabilization of US Treasury yields and continued strength of AI/semiconductor stock earnings could allow the Nasdaq 100 to reclaim targets above 30,000. This also shows that investors are refocusing on AI earnings growth after absorbing the impact of the Fed hike.
Bear case→ Additional rise in Fed Funds Rate and Oil Prices: If Brent crude remains above $100, Treasury yields will stay elevated. Anything above $110 could cause the market to reprice multiple additional Fed hikes. This will lead to a selloff, targeting price levels below 28,000.
Technical Outlook
The Nasdaq 100’s immediate trading range is becoming increasingly important. The bounce from the 28862 support met resistance at 29752, keeping the Nasdaq 100 index range-bound between the two boundaries.
The bulls need to uncap the 29752 resistance to extend the recovery move, targeting the 30 June and 14 August highs at 30246. The all-time high at 30759 becomes available for reclamation if the bullish move takes out the 30246 barrier.
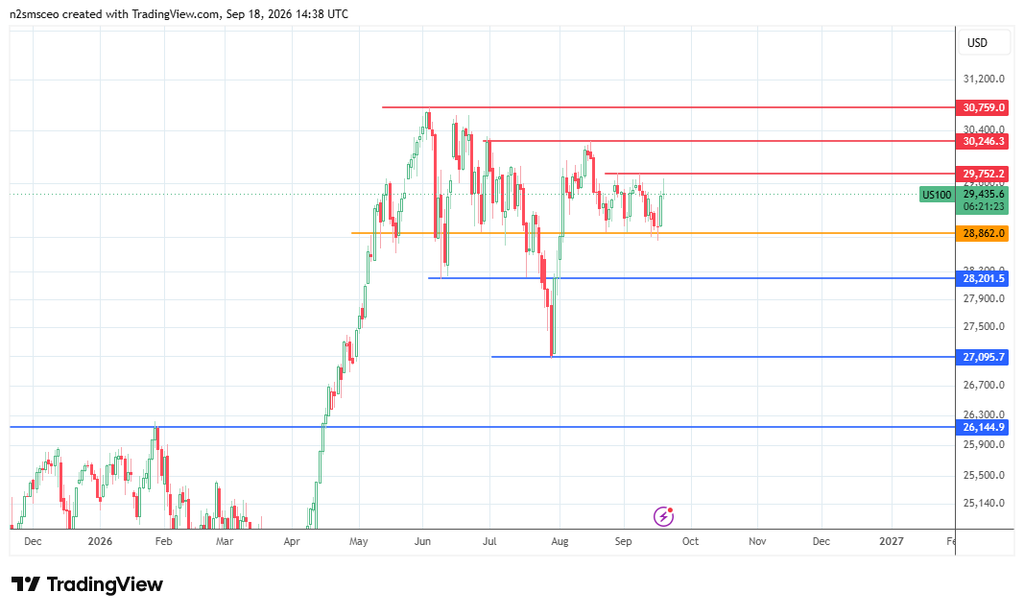
On the other hand, a breakdown of range support at 28862 extends the retracement, initially targeting the 9 June low at 28201. If this new support fails, a potential drop to the 27095 support (29 July low) cannot be ruled out.