
- Gold prices remain under pressure despite modest recovery as new Fed Chair Kevin Warsh assumes office on Friday.
The major talking point this week on gold prices comes from the Fed. The US Senate and House of Representatives confirmed the appointment of a new Fed Chair in the person of Kevin Warsh. Kevin Warsh has been confirmed for an initial 4-year term as Fed Chairman and for a 14-year term on the Federal Open Market Committee (FOMC), the Fed’s board that sets US interest rates. Warsh’s tenure officially commenced on 14 May, the day outgoing Fed Chair Jerome Powell steps down. However, he will be sworn in on Friday by US President Donald Trump.
Warsh enjoys support from the White House, but will have his work cut out for him, as the current US-Iran war and the blockade of the Strait of Hormuz have driven oil prices to multi-year highs. The rise in energy prices is now driving inflationary expectations, and last week’s Consumer Price Index and Producer Price Index data show that prices of inputs, raw materials, fuel, goods, and services have all spiked. US President Trump was famously very critical of outgoing Fed Chair Powell for leading a Fed that did not cut interest rates as fast as he would have liked. With inflation now staring the US economy in the face, it remains to be seen how Warsh would navigate the Fed in addressing the inflation expectations (moving towards tightening), or keeping monetary policy loose in dancing to the tune of the US President.
Gold Prices: Significance of The Fed Chair Appointment
The appointment of a new Fed Chair is not really a big deal in itself: it is a tenured position, and since the end of Ben Bernanke’s tenure in 2014, Janet Yellen and Jerome Powell have filled that position. However, this new appointment is very significant, as it signals not just a personnel change but a policy regime change.
The new Fed Chair is a noted hawk who does not favor prolonged easing. He has historically favored monetary policy tightening, having been a former member of the FOMC between 2006 and 2011. One of the cardinal points of his testimony before the US Senate was that the Fed would have to trim its balance sheet by offloading its US bond holdings, and that the Fed would “stay in its lane,” suggesting a more passive role in market operations by the apex bank. Selling off these mortgage-backed securities and US bonds would raise bond yields and lead to higher borrowing costs, both market-tightening actions, even without an obvious interest rate adjustment.

These points in Warsh’s address immediately sent the US Dollar soaring on the day of the testimony, which sent gold prices plunging from $4707 on 14 May to a low of $4480 on Monday, 18 May. The hawkish momentum was also sustained by the FOMC minutes which indicated a growing concern among Fed policymakers to the point that discussions about a potential rate hike were held at the last Fed meeting. This indicates that the new Fed Chair will be inheriting a more hawkish board than was the case when his name was first mentioned as a potential successor to Jerome Powell.
Coming on the back of the oil shock risk premium, gold prices have been in a choppy consolidation, with a downside skew on rising oil prices. Gold prices remain under pressure but continue to trade within identified price boundaries.
Gold Price: Technical Outlook
The 15-minute chart is the focus for today. The support and resistance levels have been traced. The intraday resistance on Monday, 18 May, and the inverse head-and-shoulders low on 20 May at 4452 are the price boundaries for the week. The inverse head-and-shoulders pattern was confirmed by the break of the neckline at 4508, which provided an endpoint of 4561 for the pattern’s measured move. This point was attained earlier in the session, with a rejection and retracement to the 4508 neckline once more.
The price continues to trade around the minor barrier at 4529, keeping it restrained within the 4508-4561 range. Any further advance and recovery in gold prices requires an uncapping of the 4561 resistance, which would allow a reclaim of the 18 May top at 4584.
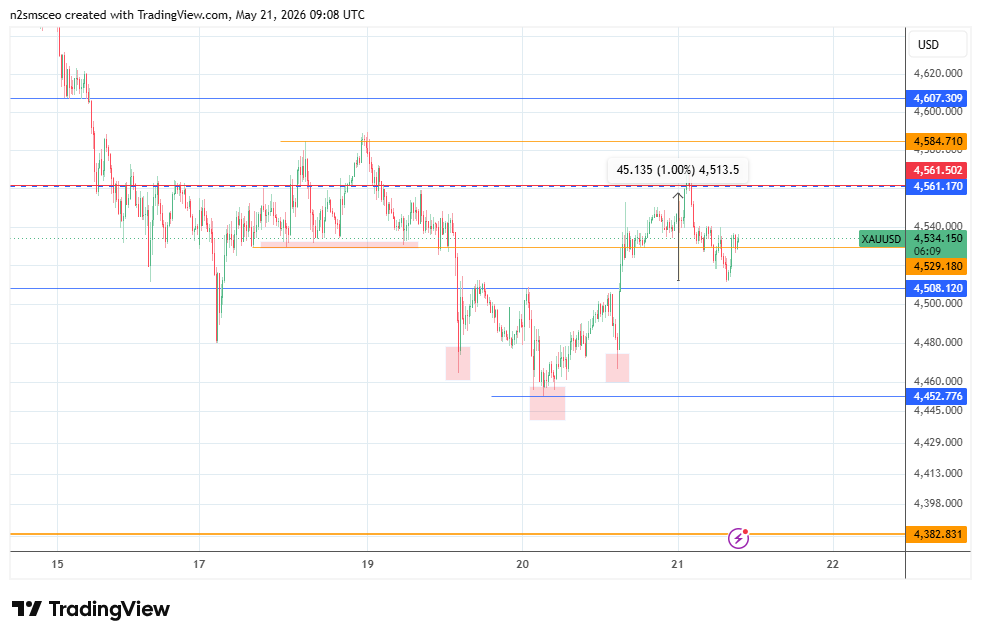
On the flip side, a breakdown of the 4529 and 4508 support levels suggests a decline towards the 4480 support level and the prior low of 18 May. Below this level, the 4452 trough, where the head of the inverse head-and-shoulders pattern lies, becomes the next target for the bears.
