

- The “hot” CPI print has helped support the US dollar, which has seen gold rejected at key resistance levels, with gold now threatening to break below its key 200-period moving average.
- Energy costs are still persistently high and US Treasury yields are rising, providing a continued “ceiling” for precious metals as investors continue to opt for high-yielding bonds over non-interest-bearing assets in a “higher-for-longer” interest rate environment.
Gold struggled to gain momentum after the US CPI came in higher than expected, signaling that economic price pressures remained elevated. This release reinforces the view that the Federal Reserve is unlikely to rush into cutting interest rates. Annual consumer inflation accelerated to 3.8% in April, exceeding market expectations and marking a notable increase from the previous month.
Meanwhile, core inflation, closely monitored by the Fed, remained firm, suggesting underlying inflationary pressures are still intact. The report showed that the acceleration in energy prices was a major contributor to the monthly increase in inflation, while housing and food costs also continued climbing. This combination strengthens expectations that US interest rates could stay higher for longer, pushing Treasury yields and the US dollar higher in response.
The backdrop for gold remains difficult, with higher yields lifting the opportunity cost of holding non-yielding assets such as bullion. Traders have therefore taken a more cautious view of XAU/USD, and the metal is finding it difficult to build on recent recovery moves, even amid continuing geopolitical and economic uncertainties.
Gold Rate Today: What Are the Potential Scenarios?
Gold is trying to find some footing on the 4-hour XAU/USD chart after a lengthy correction, but the structure remains tentatively bearish until buyers can recapture important resistance.
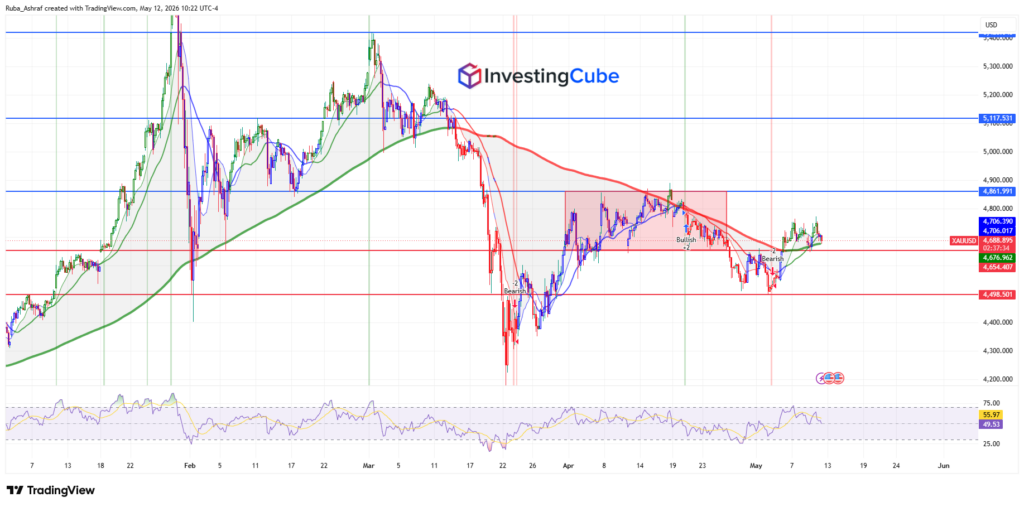
The moving averages are still showing mixed momentum. The short-term averages have turned slightly upward after the rebound from the May lows, indicating improving near-term sentiment. But the big red long-term moving average is still above the price and still heading downwards, so the bigger medium-term trend has not turned bullish just yet.
The market structure is clearly defined by the horizontal levels:
- Immediate resistance is seen at 4,708-4,720, where the price is currently struggling.
- A more significant resistance zone is found around 4,861, which is also in line with previous swing highs and the upper boundary of the highlighted consolidation area.
- Beyond that, the next major bull target is 5,117, then the 5,375 peak resistance.

On the downside:
- 4,676 is holding as the first important intraday support.
- 4,654 will be an important support level, and if lost, could negate the recent recovery structure.
- 4,498 is the critical bearish target and big swing support.
The RSI near 56 reflects neutral-to-mild bullish momentum. It is above the 50 midpoint, showing buyers regained some control after the recent rebound, but it is not yet in overbought territory.
Potential scenarios:
If XAU/USD holds above the 4,676–4,654 support region and breaks decisively above 4,720, buyers could target 4,861 first. A sustained move above that area would strengthen the case for a broader recovery toward 5,117.
Failure to maintain support above 4,654 would likely confirm the recent rebound as merely corrective. In that case, sellers may push gold back toward 4,498, with deeper downside possible if risk sentiment and US yields continue strengthening.
Although gold is a traditional inflation hedge, the “hotter than expected” 3.8% print fueled expectations that the Fed will keep interest rates higher for longer, which strengthens the US Dollar and pressures non-yielding assets like gold.
Increasing oil prices are the main driver of the current inflation spike. This increases US Treasury yields, which is generally a technical “ceiling” for gold, as investors prefer guaranteed yields from bonds over precious metals.
