
- USD/INR remains in a strong uptrend as surging crude oil prices continue to pressure the Indian rupee and widen India’s current account deficit.
- Stalled US-Iran peace talks pushed oil prices above $96 per barrel, intensifying concerns over India’s heavy reliance on energy imports and foreign exchange reserves.
- Technically, USD/INR is testing a major resistance zone near 95.40, with a confirmed breakout potentially opening the path toward the 96.00 and 97.00 levels.
The Indian rupee is still under a lot of pressure as the domestic economy is dealing with increasing geopolitical tensions and rising energy prices. The main reason behind the recent weakness in the INR is a major external supply shock after deadlocked US-Iran peace talks led to a sharp rally in crude oil prices, with Brent crude climbing more than 5% towards the $96 per barrel zone. Worries about the country’s trade balance and the rising current account deficit have increased due to the jump in energy costs, as India imports nearly 80 percent of its crude oil needs.
The rupee’s investor sentiment has been further dented by PM Modi’s recent austerity appeal, where citizens were asked to reduce fuel consumption and refrain from excess gold purchases. Markets took the comments as a sign of policymakers’ worry about the pressure on India’s foreign currency reserves because of high import bills and continued demand for dollars.
USD/INR still holds a strong bullish structure in this fundamental backdrop, with the pair now approaching a key technical resistance zone near 95.40.
USD/INR Technical Outlook:
The USD/INR currency pair has been in a steady uptrend and is currently testing a very critical resistance zone around 95.40. A strong break above this level could add further bullish momentum and open the door for a move into the higher resistance areas around 96.00 and possibly 97.00 in the medium term.

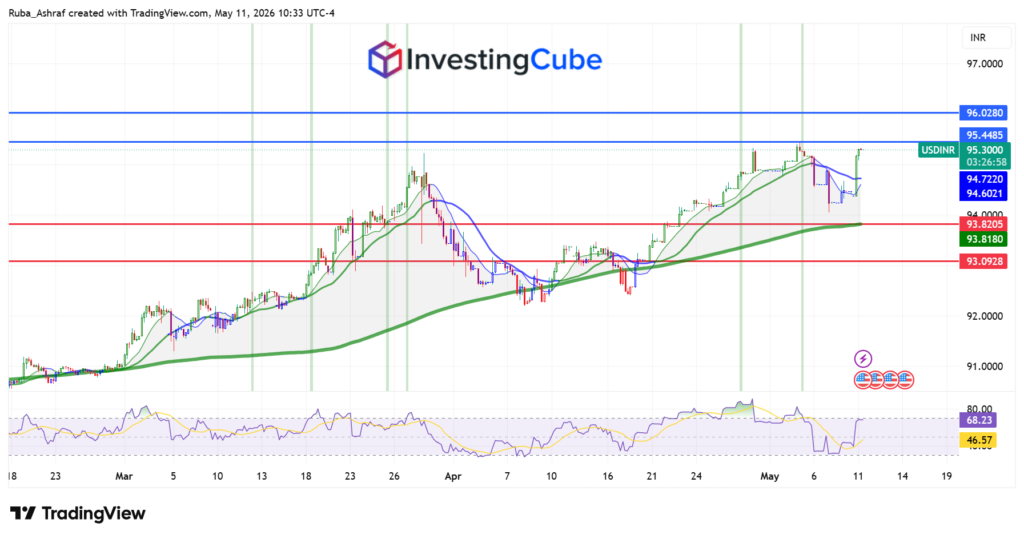
From the chart structure, price action continues to respect the broader bullish trend, supported by the upward slope of the moving averages. The pair remains comfortably above the longer-term moving average around the 93.80 region, which reinforces the positive market structure and suggests that buyers are still in control of the broader trend.
The pair is currently hitting a major “ceiling” at the blue horizontal resistance line of 95.44. This level is particularly significant as the rupee recently hit a record low of 95.23 on May 11, 2026. Below this, there is strong support established at the red lines of 93.82 and 93.09.
The RSI indicator also bounced strongly out of the oversold territory and is now pushing back up to the upper range near 68, showing improving bullish momentum. But the indicator is once again nearing overbought territory, which could boost the chances of some short-term consolidation or temporary profit-taking ahead of any sustained breakout attempt.
Overall, the technical structure still favors the upside while the pair trades above the 93.80 support region, with the market closely watching whether buyers can finally clear the major 95.40 resistance barrier.