
- USDINR forecast 2026 is bullish as a spike in crude oil prices, Federal Reserve-RBI rate differentials and foreign dollar outflows weigh in.
The Indian rupee experienced considerable volatility during the first quarter of 2026. While the year began with a degree of stability, the currency soon encountered a confluence of geopolitical and macroeconomic pressures, ultimately leading to unprecedented lows against the US dollar.
Data from exchange rate histories indicates that the USD/INR pair commenced January around the 89.87–90.00 mark. However, it faced persistent downward pressure, which notably intensified throughout March. Towards the end of March, the rupee moved past historical lows, hovering around 93–95, with certain accounts even recording a brief move above 95 on March 30.
Monthly average figures illustrate this trend: roughly 90.87 in January, 90.74 in February, and then an ascent to 92.88 in March. Collectively, the rupee saw a depreciation of approximately 4–5% or more against the dollar in Q1, making it one of the less resilient currencies in Asia amidst the prevailing global uncertainties.
By mid-April 2026, the USDINR pair was observed trading near the 93.10 level, indicating a substantial depreciation from its 90.00 position at the close of 2025.
This article was originally written in December 2024 and updated on April 20, 2026, to reflect recent developments, including US-Israel/Iran war and ensuing Strait of Hormuz blockade, USD/INR price movements, and the impact of oil price spike. All technical levels and market commentary are based on the latest data available at the time of writing.
USDINR Outlook in 2026
The trajectory for the rest of 2026 is not uniformly grim, but optimism requires conditions that are not yet assured. The most constructive scenario hinges on a meaningful de-escalation in the Middle East bringing oil prices back below $85–90 per barrel, a ceasefire-led recovery in FPI sentiment, and a weaker US dollar as the Federal Reserve resumes rate cuts
Forecasts from various institutions vary. Some project stabilization or modest appreciation toward 87–90 by year-end if Fed rate cuts materialize later in 2026, oil prices moderate, and trade dynamics improve. Conversely, other projections suggest the rupee could remain within the 92–95 range or even weaken further if geopolitical risks persist or if oil prices average above $85–100. The RBI’s own planning for FY27 incorporates an average exchange rate assumption close to 94, indicating an expectation of ongoing volatility.
RBI Interventions Do Little to Limit the Rupee’s Losses
The Reserve Bank of India worked diligently to mitigate the adverse effects, though the extent of its resources was put to the test. Business Standard estimated the RBI’s dollar sales at $26–27 billion in March alone, with overall dollar sales from late February to early April totaling $40 billion, consequently reducing forex reserves from a peak of $728.5 billion to $688 billion.
Impacts of Interest Rates
The interest rate story of the first quarter of 2026 didn’t help the rupee. The RBI kept rates steady at its February 2026 meeting, despite the rupee getting weaker and bond yields going up. The RBI had cut its repo rate by 25 basis points to 5.25% in December 2025.
April brought fresh pressure from rising tensions in Iran, weighing on economic forecasts while pushing prices upward. Still, the central bank held its ground, keeping borrowing costs steady to guard against wider imbalances.
Meanwhile, US monetary policymakers showed little hurry to adjust their own rates downward. Because of this divergence, investors kept leaning toward American securities, drawn by stronger returns in dollar-based investments.
Impact of Oil Prices on the Rupee
India is the world’s third-largest imported of crude oil, and the product’s price oscillations have a significant impact on the rupee. Dollar-denominated crude oil has experienced a slowdown in demand for the last year, as China’s economic growth declined.
According to the International Energy Agency (IEA), demand for the commodity is projected to rise by 1.05 million barrels per day (bpd) to a total of 104 million bpd in 2025. The growth is attributed to the recovery of China’s economy as stimulus measures yield fruits. A spike in the demand for oil could increase the price and fuel gains by USDINR.

Nothing destabilised the rupee in Q1 more comprehensively than crude oil. When war between the U.S.-Israel, and Iran intensified in late February, global markets reacted fast. Brent crude jumped from roughly $60 a barrel to over $100, peaking near $120 at one point. The Indian crude basket, which factors in the specific grades India imports, reportedly climbed as high as $157 per barrel before settling around $116.
Given that India’s economy relies on imports for roughly 85% of its oil needs, the immediate pass-through was evident. State-owned oil corporations became continuous purchasers of dollars in the foreign exchange market, generating a structural demand pressure that proved challenging for any central bank to readily mitigate.
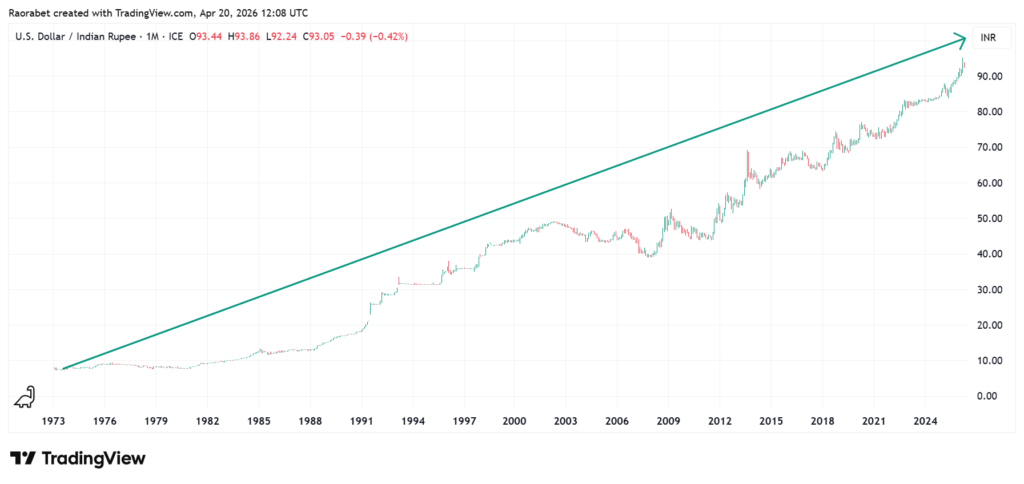
USD/INR Historical Chart
USD to INR trading dates back to 1973 when the pair was floated in the forex market at an opening price of $1 to 7.98 rupees. By late 1983, the currency pair rose past the psychological level of 10 rupees to the US Dollar. Between then and April 2002, it rallied by 376.41% to 48.76 rupees.
After retracing to 39.9 rupees in November 2007, the USD/INR has been on an uptrend since then. The pair surged to an all-time high of 95.23 in March 2026.
As the US Federal Reserve started to hike rates, Indian rupee started to slide against the US Dollar. In October 2022, the pair surged to a new all-time high of 83.28. This ATH was refreshed in 2023. However, the dollar’s rally in 2024 saw it hit a new ATH on March 22.
Strain on Indian Equities Markets
Indian equity markets introduced an additional layer of pressure on the currency. March 2026 saw considerable outflows from Indian assets as global investors gravitated towards the perceived safety of the US dollar. This demand for the greenback as a safe haven, combined with elevated US bond yields, contributed to a reduction in foreign institutional investor (FII) inflows.
While the global stock rally in April offered a measure of relief, the volatility experienced in Q1 fostered a market sentiment where investors tended to acquire dollars during downturns, thereby limiting any potential for rupee appreciation.
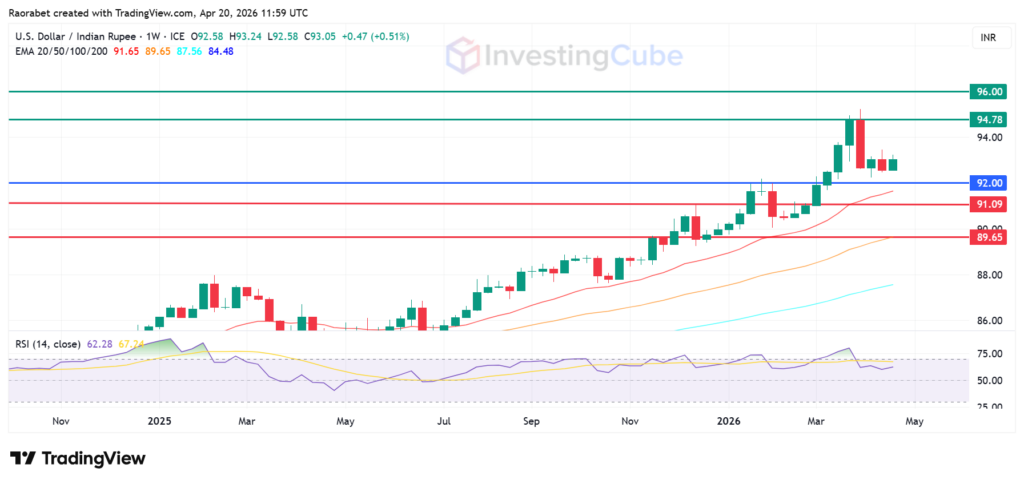
USD/INR Quarterly Outlook: Rupee Faces Next Key Resistance At 96.00 in Q2
Buyers stepped in strongly above around 92.00, keeping things stable so far
- But 96 is proving tough to crack — it’s acted like a ceiling all week
- If that level breaks, next upside target is 100.00
- RSI is steady — currently near 62
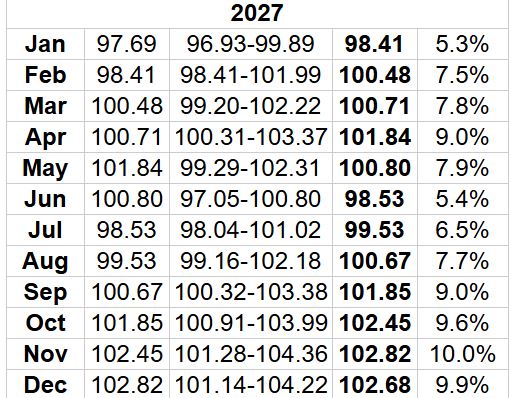
What will be USD to INR Rate in 2027?
Long Forecast’s USD to INR forecast 2027 suggests the start of the year around 97.69 rupees. It expects the currency pair to average 98.53 by mid-year before rallying further to 102.82 by the end of the year. The prices can go much higher if the global economy enters a prolonged recession after the ongoing deflationary measures.
USD to INR Forecast 2030
A feasible USD to INR forecast for 2030 is informed by the economic health of India and the US, Fed and RBI’s monetary policy, and the demand for the US dollar as a safe haven. Hence, a strong dollar will likely push USD to INR to a new record high, depending on the key drivers.
However, as an emerging market, India’s currency has the potential to strengthen further in the coming years. From that perspective, USD to INR forecast 2030 will be for the pair to remain within a range for several years.
How to trade USDINR
To trade USDINR, one needs to open an account with a reputable forex broker. When researching the best broker, it is helpful to consider their spreads, commissions, and other fees. It is also possible to trade the currency’s derivatives in the form of USDINR futures.