

- The FTSE 100 is largely protected from a sharp domestic slowdown (weak May PMI of 48.5) by rising oil prices ($107.98/bbl) and a large 75% international revenue exposure that gains from weaker Pound.
The FTSE 250 is struggling hard against a weak UK consumer market, while the FTSE 100 has broken above the historic 10,400 level and is structurally resilient. Some 75% of the FTSE 100’s revenues come from abroad. Its fundamentals are much more linked to global commodity prices, international trade, and big currency moves than the performance of the British high street.
In this piece, we examine the crucial, latest fundamental factors that you need to know about and the technical view for the FTSE 100, including the main levels to monitor.
How energy and commodity giants are protecting the FTSE 100
The FTSE 100 is dominated by mining giants and oil majors, so they are the main protection for the index.
- The Iran-U.S. conflict, stalled peace talks, and continuing tensions in the Middle East have pushed up global oil prices. This hurts the global consumer but directly inflates the earnings and cash reserves of index heavyweights like Shell and BP.
- On the flip side, this greater uncertainty in the world has kept gold and industrial metals high. That provides a huge structural tailwind to the index’s big weight in the mining sector. This enables the index score gains even as global tech indices retreat.
How is the UK growth slowdown impacting the interest rate path?
Data on the UK May PMI were released, and the UK private sector unexpectedly moved into contraction territory this month. The May Composite PMI dropped to a poor 48.5 from 52.6. These were all services, which decreased to 47.9
The Bank of England is in a jam. Growth that is weak usually means that the Bank of England will have to cut rates sooner. Input costs are sticky because of global energy-driven inflation. A slide in the British pound (GBP) could occur if the market starts to price in the prospect of UK rate cuts arriving earlier than anticipated to support the domestic economy. Ironically, it would boost the FTSE 100, as its massive foreign earnings would be converted back into sterling at a higher rate.

FTSE 100 Technical Outlook:
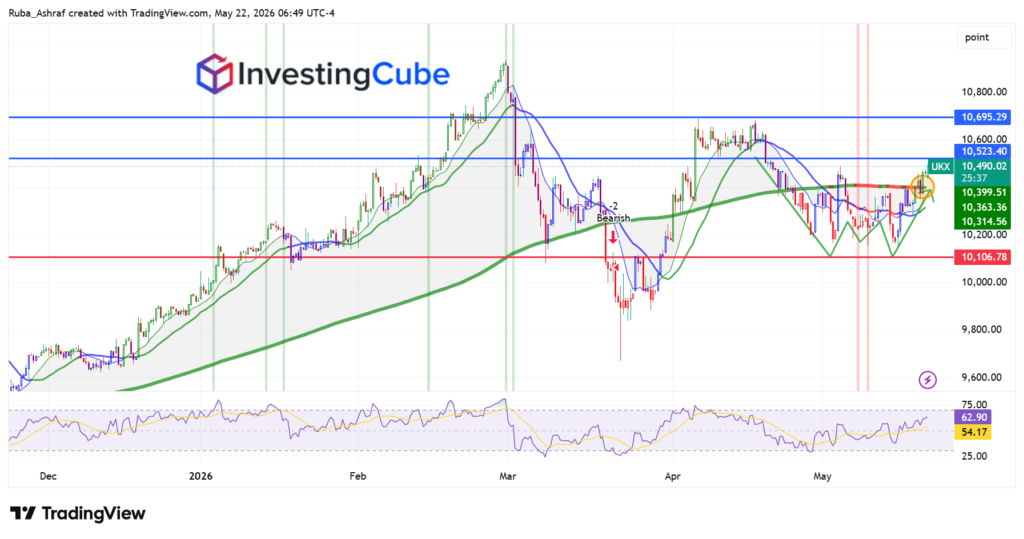
The FTSE 100 chart first created a clear head and shoulders reversal pattern around the March high at about 10,850. The left shoulder was put in place in the late February consolidation, then the cycle high saw a violent rally into the head before the market failed to hold onto the bullish momentum and rolled over into the right shoulder formation. Finally, the neckline at 10,300-10,200 broke, and we saw a strong bearish continuation move to the March lows near 9,900. That break confirmed a medium-term shift from bullish to corrective momentum.
Following the selloff, the FTSE 100 managed to stabilize above the major support zone highlighted near 10,106. This red horizontal level has become a critical structural floor for the broader bullish trend because it aligns with previous breakout zones and sits close to the long-term moving average support. Buyers aggressively defended this region, preventing a deeper retracement and allowing the index to recover steadily during April and May.
Key upside barriers are the blue resistance levels at 10,523 and 10,695. The 10,523 level is particularly significant, as it has been a rebound barrier several times and coincides with prior congestion. A break above would point to stronger bullish momentum and pave the way towards 10,695. Below that, though, the structure still appears to be a recovery rather than a full breakout.
The outlook from a moving average’s perspective has improved. Price has reclaimed the long-term moving average at around 10,300-10,350, which is now acting as support. Shorter-term moving averages are curling higher, indicating fading bearish momentum.
The chart also shows a possible bullish crossover as the price attempts to stay above the clustered moving averages. This would benefit a rally towards 10,523. RSI has broken above the 50 level and is sitting at around 63, which shows strengthening momentum without being overbought. The RSI trend is turning supportive, giving scope for more upside.
- The bullish case depends on holding 10,300–10,350 and breaking 10,523, which could lead toward 10,695 and potentially yearly highs. Oil and mining strength continue to support the index.
- On the downside, failure to hold 10,350 can trigger rejection and a move back to 10,106. A break below that will weaken the structure and open up 10,000 and possibly 9,900.
