
- Sustained high oil prices and record-breaking dividend forecasts continue to provide a strong fundamental floor for the index despite the Bank of England's cautious stance on interest rates.
The FTSE 100 has been trying to overcome the same resistance level since the technical outlook of last week. But it is still expected to post gains even while staying under pressure at 10,480. British shares edged higher on Wednesday with fresh signals from Washington and Tehran pointing to possible de-escalation in the Strait of Hormuz. The development eased concerns about disruption to global energy supply. In response, crude oil prices fell by approximately 5.60% on the signals of de-escalation.
Britain’s blue-chip FTSE 100 is up 2.15%, or 221.23 points, as of today at 16:43 GMT+3. Germany’s DAX index is up 1.78%, or 433.26 points, while France’s CAC 40 has climbed 2.97%, or 239.7 points. These bullish movements in key indices suggest that investors have maintained their risk appetite following US–Iran de-escalation hints. Let’s take a look at the key fundamental drivers of the FTSE 100 index.
FTSE 100 Key Fundamental Drivers:
- The pivot in monetary policy: The Bank of England (BoE) kept rates at 3.75% in May 2026 but warned of possible hikes if energy shocks from the ongoing Middle East conflict continue to feed through into inflation. March’s plans to cut rates had been abandoned after oil prices surged.
- Commodities were affected by geopolitical tensions:
Tensions in the Middle East have helped push crude oil prices (WTI) toward $107-$110 a barrel. Energy and mining have a heavy weighting, and commodity spikes are the big FTSE 100 drivers. A full 54% of the index’s pre-tax income comes from financials, oils, and miners.
FTSE 100 Technical Outlook:
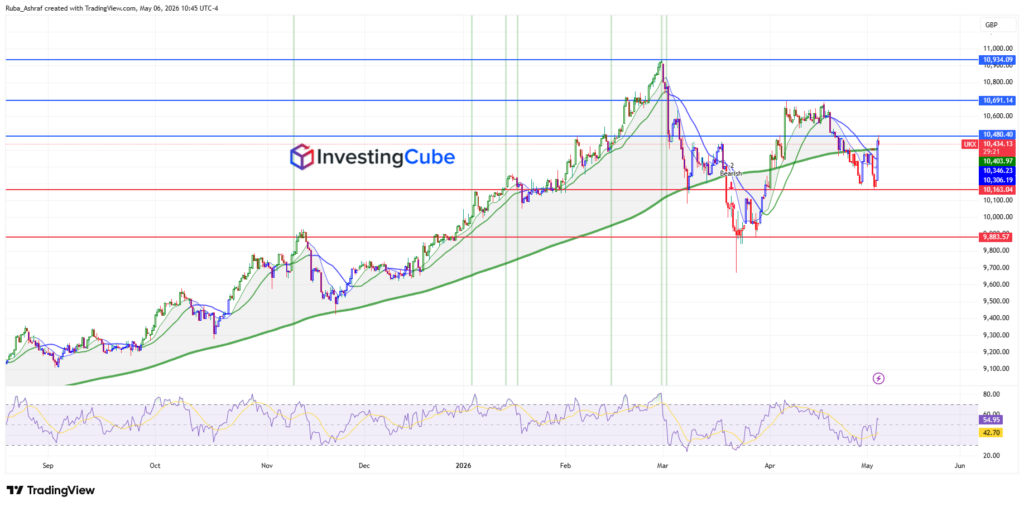
FTSE 100 is trading around similar levels but with better momentum evident. The index has rebounded strongly from the 10,163 support level and has moved higher towards 10,480, where it is currently testing a key resistance zone. This move shows renewed bullishness and better risk appetite as buyers look to drive for a breakout towards higher levels.

Now, the index is supported by a cluster of moving averages. The price trades just above the long-term green moving average at 10,403.97. Currently, it acts as a dynamic floor. However, the 10,480 level remains an important obstacle, corresponding with earlier price rejections and serving as a short-term ceiling. A strong break above this level could open the door for 10,690 and 10,934, the next major resistance levels on the chart.
The RSI has recovered from lower levels and is moving back toward the neutral 50 zone, suggesting improving momentum but not yet overbought conditions. This indicates there is still room for further upside if buying pressure continues.
A decisive breakout above 10,480 would likely confirm bullish continuation, targeting higher resistance levels. On the other hand, failure to break this zone could lead to another pullback, with immediate support at 10,300-10,163. A break below this support would weaken the bullish structure and shift the focus back toward deeper levels near 9,883. Overall, the index is at a decisive point, with momentum improving but still dependent on a confirmed breakout.
Analysts expect a total dividend payout of £88 billion this year, a record high, and a forward yield of around 3.3%.
The Bank held at 3.75% in May but warned it may need to hike again to fight energy-driven inflation, setting the stage for a “choppier” but resilient index.