



- The USD/INR is currently 1.51% lower after the RBI's intervention, but can the RBI's measures overcome the external pressure from oil prices?
Current setup
A series of Reserve Bank of India interventions has caused a sharp selloff in the USD/INR, sending the pair toward the 95.2700 mark after an intraday high of 95.7600. The intervention, which was monitored across several sources, began on Monday and occurred at sequential price levels. As such, the USD/INR is down 1.51% since the intervention began.
Market sentiment has shifted toward rupee strengthening, even as the medium-term outlook for USD/INR remains clouded amid elevated oil prices, a geopolitical risk premium, foreign portfolio investor outflows, and India’s external financing picture.
Current narrative:
RBI intervention + ↓ speculative dollar demand → ↓USD/INR lower
USD/INR: Current Macro Drivers
1. RBI Intervention Ramp
The RBI has ramped up its intervention mechanism, broadening its scope to reduce speculative positioning against the rupee and reduce dollar demand. The RBI has also introduced steps to redirect oil-driven dollar demand away from spot markets, while imposing extra requirements on naked derivatives trading and certain foreign-exchange hedging transactions.
India’s apex bank continues to sell dollars to support the local currency. These measures helped secure a sharp rupee recovery after it weakened to 96.78 in late Friday trading. However, the measures are not expected to have a long-lasting impact on the pair, as they do not reduce dollar demand, foreign portfolio fund exits (which dump the rupee for the USD as funds seek external destinations), or the geopolitical risk premium.
2. RBI Rate Hike
The RBI raised its policy repo rate on 7 October. The 25 bps hike to 5.50% was the first since February 2023, driven mainly by higher energy and food costs from higher oil prices. The hike provides temporary support for the rupee by widening the yield differential with low-yielding currencies. It also raises the cost of speculative bearish positioning in the rupee. However, the Fed’s hawkish path is quickly eroding the yield benefits of this hike, especially as global bond yields keep rising. Traders will now watch whether the RBI offers additional hawkish guidance or whether growth and inflation data will shape its trajectory.
The next focus is therefore on whether the RBI maintains a tightening bias or signals that further increases will depend on inflation and growth.

3. Oil prices and capital flows
As a major crude-oil importer, India’s economy and currency are highly vulnerable to higher oil prices. The resulting increase in the country’s import bill, and the need for additional USD funds to cover rising import costs, put structural pressure on the rupee.
A weaker rupee forces foreign portfolio investors to exit Indian markets and seek new destinations to protect the value of their holdings. This process requires selling financial assets in rupees and converting them to US Dollars (thus raising dollar demand and increasing rupee supply). The latest RBI measures aim to reduce this spot-market demand, but they are hard to sustain against higher energy prices or foreign capital flight.
USD/INR Forecast Scenarios
Bull case for USD/INR: A recovery from current levels that clears the prior psychological price zone at 96.00–96.30 suggests that the RBI’s intervention has lost steam. If the relevant price candle closes above 96.50, this could reopen the pathway toward 97.00.
Base case: USD/INR consolidates between 95.00 and 96.30 as the counterbalance between the RBI’s interventionist measures and continuing rupee pressure/dollar support from the geopolitical risk premium and elevated US bond yields plays out.
Bear case for USD/INR: A sustained break below 95.00 indicates that rupee strength has not run out of steam. This support breakdown could expose 94.90 and then 94.20. Softer oil prices and lower bond yields would support this outlook.
Technical Outlook
The 95.24 support holds firm for now. However, a breakdown of this pivot exposes downside targets at 94.28 initially (Jun2 2026 and 3 September lows), and potentially 94.04 (61.8% Fibonacci retracement of the 9 April – 20 May 2026 upswing).
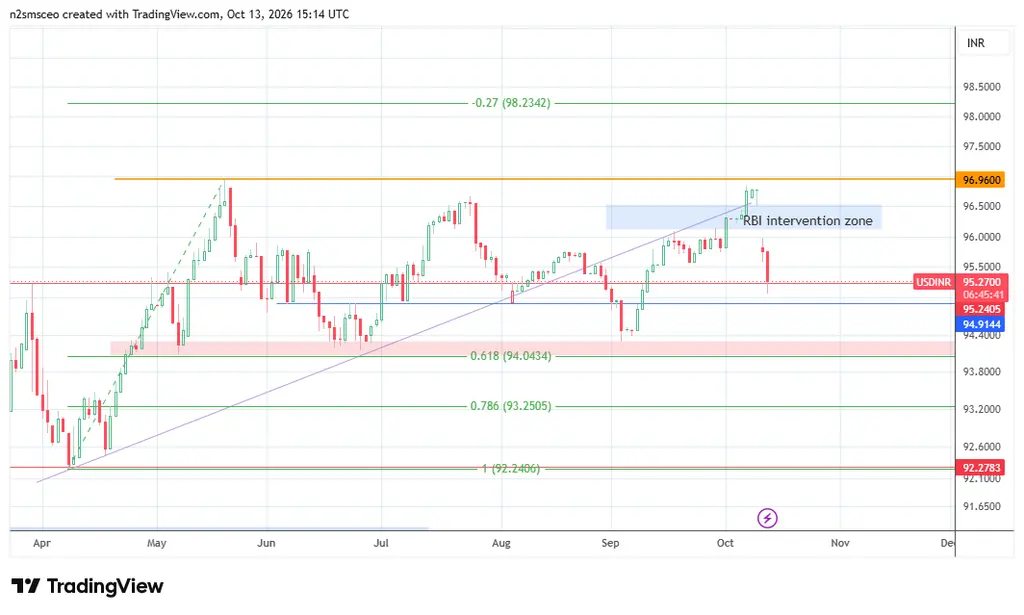
On the flip side, a bounce from the current support targets the 96.00 psychological barrier (25 September and 12 October 2026 highs). If the bounce clears this barrier, the next target is the 96.96 resistance and prior high of 20 May 2026, which remains the all-time high.