




- Gold prices are attempting to hang on to the $4100 support after a modest recovery following Tuesday's steep plunge.
Current Setup
With no major news impacting the US Dollar this week, according to the economic calendar, gold is currently trading in an environment driven by safe-haven demand (geopolitical factor) and a powerful yield/USD headwind (from US Treasury yields).
Gold is trading just above $4,120/oz, staging a late recovery on Wednesday after falling to a two-month low on Tuesday. Elevated US Treasury yields sent flows away from the non-yielding yellow metal and into USD-denominated assets. The impact was huge, sending gold prices tumbling, as elevated Treasury yields overwhelmed any support for the yellow metal from safe-haven demand.
The clearest confirmation of a sustainable gold price recovery will come from falling US bond yields, with the 5.00% mark as the line in the sand.
Higher US bond yields + stronger USD → Lower gold prices
versus
Flight to Safety from geopolitical risk + central-bank demand → Higher gold prices
These are the competing forces for the rest of this week that will determine if gold prices can hold above $4100/oz.
Gold: Today’s Macro Drivers
1. US Treasury Yields/Fed Rate Expectations
The minutes of the 16 September FOMC meeting were released Wednesday evening. The minutes showed the Fed remained divided despite the rate hike and the push toward a hawkish dot plot. Most policymakers still see rates rising further before year end, in line with the dot plot.
The weak jobs data has sharply reduced the market’s odds of a September rate hike. Even Goldman Sachs, which originally forecasted an October rate hike, has moved its expectations to the December meeting. This is now reflected in the Fedwatch tool, which shows only a 21.6% probability of a rate hike at the October FOMC meeting but an 85% probability of a December rate hike.

This hawkish projection suggests the environment still supports further rises in US bond yields, creating a significant headwind for gold prices because higher yields make the US dollar and related assets far more attractive than the non-interest-yielding metal.
Hawkish Fed expectations → ↑ yields → ↑ USD → ↓ Gold
2. Geopolitical Risk
Geopolitical risk from the Middle East conflict continues to support gold prices through safe-haven demand. Brent crude is back above $100 while shipping remains constrained through the Strait of Hormuz and other bottlenecks. Gold prices are now suffering from the second-order effect of higher oil prices, as higher inflation expectations and the probability of tighter U.S. monetary policy could hamper or overwhelm any safe-haven demand.
3. US Dollar Demand
Gold price reflects gold vs. the US Dollar. In the financial markets, Gold is also paired with other currencies such as the Euro (XAU/EUR). The XAU/USD pair is directly impacted by the US Dollar. The USD is directly linked to bond yields, as participating funds must acquire US Dollars to buy US Treasuries and earn the fixed income from bond yields. As US Bond yields have tracked upwards, so has demand for the US Dollar. This is a material headwind for gold prices.
Gold Price: Forecast Scenarios
Base case→ Gold trades between $4,112 and $4,200: The near-term scenario depends on gold defending the current $4,112 support, even without the upside momentum to take out the $4,200 resistance. This reflects the tussle between geopolitical risk and hawkish Fed expectations/higher bond yields.
Bull case→ Gold breaks above $4,200: A sustained recovery above $4,200 requires a decline in US 10Y bond yields. This would unlock upside targets, starting at $4,240.
Bear case→ Gold breaks below $4,100: If US Treasury yields keep hovering around current levels (i.e., >5.30%), this would be bearish for gold and would initially re-expose $4,000. $3,950 remains a major support level.
Technical Outlook
4,120 has emerged as the decisive support level of note. The bulls need to take out the upper limit of the 4100-4150 price zone to expose 4313 initially (25 September 2026), followed by 4400 (18 September 2026 high) if the prior barrier is cleared. The 4 June and 3 September highs at 4503 become available if an advance uncaps 4400.
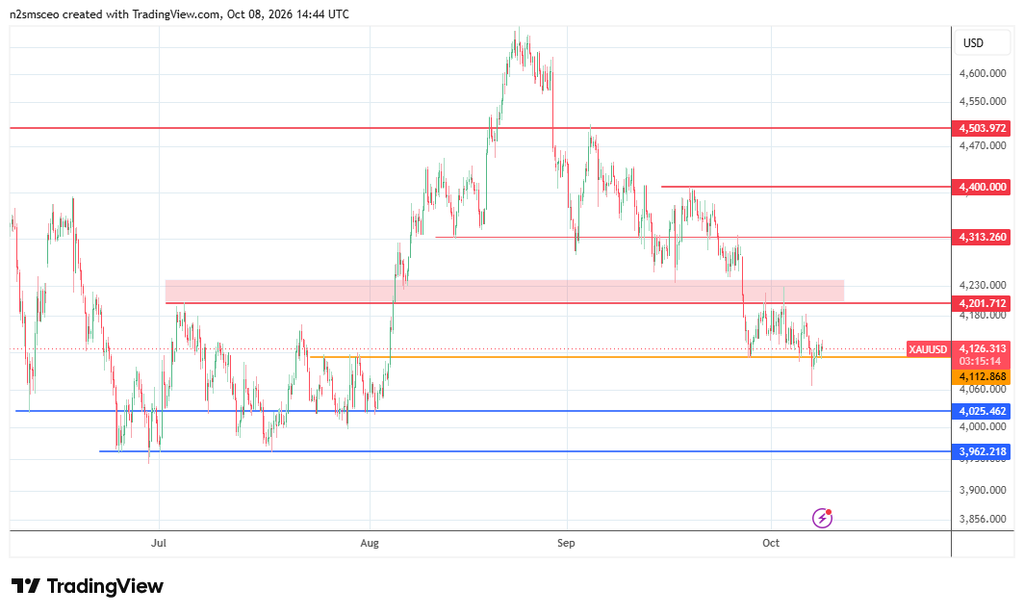
Conversely, a return to the downtrend becomes likely if 4100 fails to hold. In this situation, downside targets at 4025 (10 June and 3 August lows) and 3960 (2026 year-to-date low) become the next logical bearish targets.