




Archived Article This article was published more than 5 months ago. The market data, prices, forecasts, and analysis were accurate at the time of publication but may have changed since then. Please use this article for historical reference only and refer to our latest content for current market information.
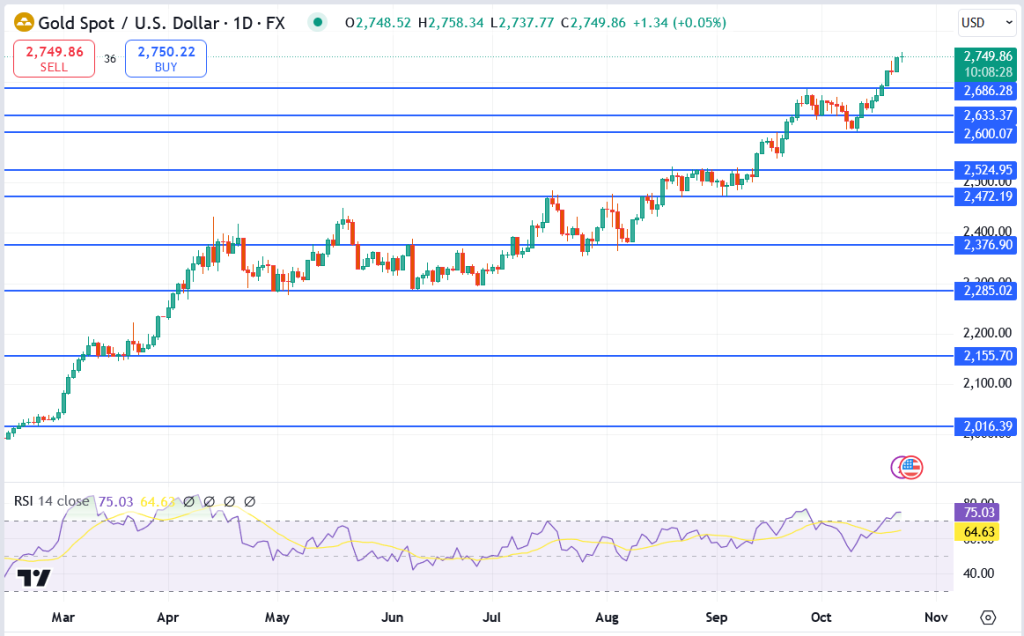
The cost of gold is continuously going up because of increasing geopolitical tensions and market instability, as traders seek safe assets. At present, gold is priced at $2,749.86 and continues to exhibit a positive direction on the daily graph.
Chart Analysis
- Key Support Levels:
- $2,686.28: A recent support level that has held well during slight pullbacks. A break below this could trigger more selling pressure.
- $2,600.07: A major support level established in September, marking a strong foundation if prices start to dip.
- $2,524.95: This level has acted as a pivot point in August, providing significant support in the past.

- Key Resistance Levels:
- $2,758.34: The immediate resistance. If gold can break above this level, it could pave the way for a push toward new highs.
- $2,800.00: A psychological resistance that could attract profit-taking. Surpassing this level could indicate stronger bullish momentum.
- $2,900.00: An extended target if gold maintains its upward momentum, particularly driven by continued safe-haven demand.
Gold Outlook
Gold is once again proving its safe-haven status, with traders flocking to the shiny metal amid market jitters and global uncertainty. Will gold finally break the $2,800 barrier and shine even brighter? Only time will tell, but one thing’s for sure—gold’s sparkle never fades, especially when the world feels a little uncertain!