




Archived Article This article was published more than 5 months ago. The market data, prices, forecasts, and analysis were accurate at the time of publication but may have changed since then. Please use this article for historical reference only and refer to our latest content for current market information.
- The pullback witnessed in Gold's price today was largely driven by the stronger-than-expected U.S. economic data...
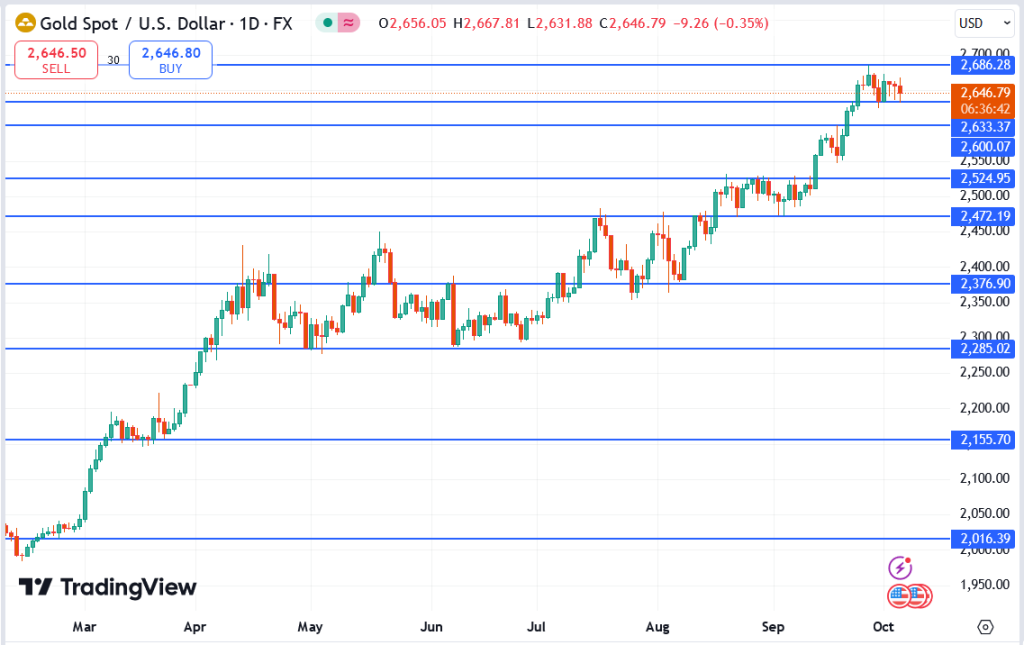
Gold is trading at $2,646, slightly down by 0.35% on the day, retreating from a recent high of $2,686. The daily chart highlights the metal’s bullish momentum over the past few months, but recent price action suggests consolidation below the critical resistance at $2,686.

Gold Key Levels
- Support at $2,633: This level has provided a base for price action over the past week. A break below it could lead to a move toward the next support zone at $2,600.
- Resistance at $2,686: Gold is struggling to break through this level, with repeated rejections, indicating intense selling pressure in this zone.
- Next Support Zones: Below $2,600, additional support lies at $2,472, a key pivot level during previous upward moves in August.
Why is Gold Trending?
The pullback witnessed in Gold’s price today was largely driven by the stronger-than-expected U.S. economic data, which has bolstered the dollar and increased pressure on the precious metal. A recent report on U.S. employment showed better job creation numbers, raising the Federal Reserve’s expectations of further interest rate hikes. This has dampened the appeal of gold, a non-yielding asset, as higher interest rates make alternative investments like bonds more attractive.
In conclusion, XAUUSD remains in a critical consolidation phase. A decisive move above $2,686 could signal the continuation of the bullish trend, while a drop below $2,633 might indicate a deeper pullback toward $2,600 or lower. Traders should watch how economic data and Fed policies unfold in the coming weeks.