



Published on . Prices and market conditions may have changed since then.
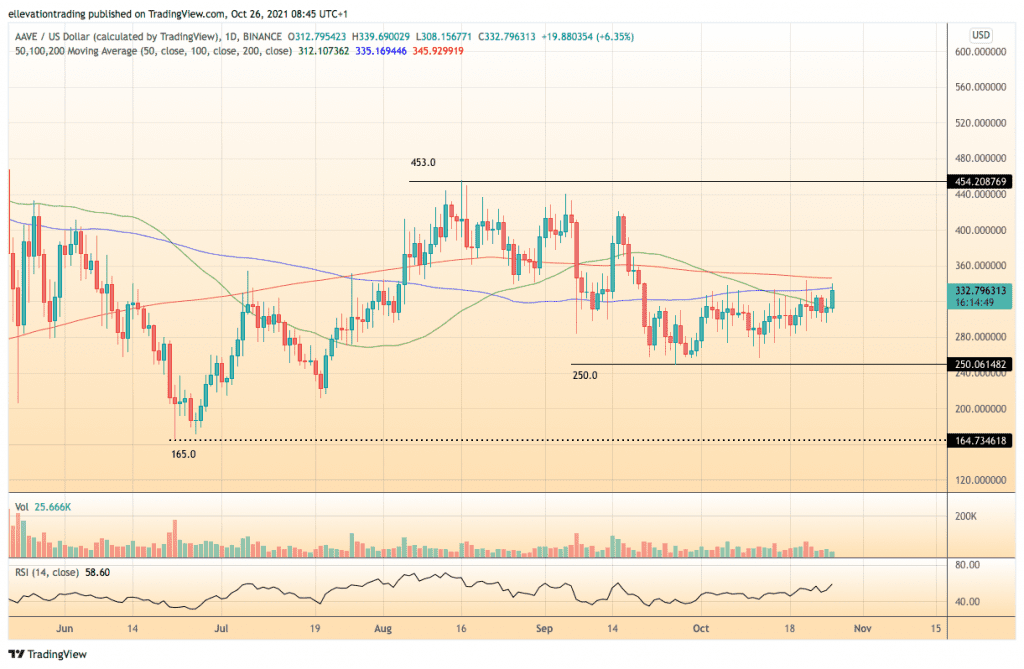
- The Aave price is attempting to clear the considerable resistance of the long term moving averages between $335 and $346 this morning.
The Aave price is attempting to clear the considerable resistance of the long term moving averages between $335 and $346 this morning. Aave (AAVE/USD) is up 6% to $331.20, and higher by 20% in October. Aave’s market cap has increased to $4.34 billion, ranking it the 44th most valuable cryptocurrency, behind PancakeSwap (CAKE/USD).
Although Aave is the leading Decentralized Finance (DeFi) protocol with Total Value Locked (TVL) assets approaching $19.5 billion, the AAVE token has somewhat underperformed. Despite climbing 30% in the last two weeks, the AAAVE price is trading 52% below May’s high. Nonetheless, the token has returned investors 246% year-to-date. Furthermore, the recent price action suggests Aave is close to a bullish breakout with the potential to target the $450 area, around 35% above the last traded price.

Technical Analysis
After reaching a three month high of $453 in August, AAVE took a tumble in September following China’s enhanced measures against cryptocurrencies. By the 26th of September, the AAVE price had shed around 45% and was changing hands at $250. Since then, the token has trended broadly higher, although struggling to clear the 100 and 200-day moving averages. AAVE has pierced the 100-DMA at $335.18 several times this month but has so far been unable to close above it. Even if AAVE Successfully hurdles the 100-DMA, the more significant 200-day average at $356 provides a stiffer test. On that basis, I would consider a close above $346 extremely constructive and a likely catalyst for an uplift towards the August high of $453.
Although the technicals are improving, the danger for the bulls is rejection at the moving averages. If AAVE reverses from here, the 50 DMA offers some support at $312. However, the significant support is way down at the September low of $250. Considering the recent price action, I favour the bullish scenario. However, until the price climbs above the 200-day moving average, it is vulnerable. Therefore, I prefer to add length on a close above $346, targeting the $450 area, closing the position if the price returns below the 200 DMA on a closing basis.
AAVE Price Chart (Daily)
For more market insights, follow Elliott on Twitter.