
At 428K versus a consensus number of 1250K, the ADP Employment change did not meet market expectations. This appears to be weighing on the Nasdaq 100, which touched off new record highs today but was quickly beaten back by selling action on the index. The appearance of today’s candle is starting to create some questions, one of which is whether the Nasdaq 100 is about to approach a top?
Mohamed El-Erian, Chief Economic Adviser of Allianz, seems to think so. In an opinion editorial provided to the Financial Times, El-Erian spoke of how some sophisticated investors had started to question the seemingly endless rally using derivative plays. According to El-Erian, economic fundamentals do not yet show any convincing recovery from the financial damage of the coronavirus pandemic.
El-Erian may be right in this regard. Positive data from the US economy have been patchy at best of late. Consumer confidence, jobless claims and even today’s ADP Employment data do not give much support to the record highs being achieved by the Nasdaq 100. Even Apple and Tesla, fresh from their stock splits, are taking a breather today.
We may already be in the phase of public participation as described by Charles Dow, as the Fear and Greed index has hit 75, very close to the levels of Extreme Greed that occurs just before a significant selloff. For now, the Nasdaq 100 continues to run on Fed-induced stimulus, but for how long? Perhaps key employment data for the rest of the week (Initial Jobless Claims and NFP numbers for August) may provide some clarity on what to expect in September.
The Nasdaq 100 is presently flat at 12351.2, as it experiences some early trading choppiness.
Technical Outlook for Nasdaq 100
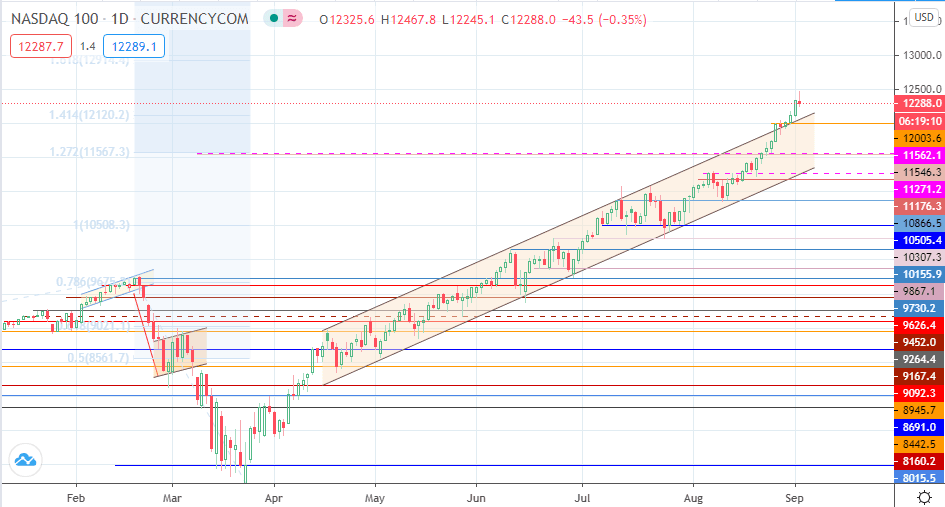
The index touched off a new record high on the day at 12467.8 but has since backed off those highs. It is well clear of the 141.4% Fibonacci extension from the 2019 swing low to the Feb 2020 top, but the 161.8% Fibonacci extension is starting to look a bit far-fetched at the moment.
A drop off from present levels allows for a pullback to 12003.6, with 11562.1 and 11546.3 lining up as potential downside targets. 11176.3 and 10866.5 are starting to look like distant support targets, but may become relevant to price action if there is a decline to the scale of breaking down the channel. Watch for Thursday’s jobless claims data and Friday’s NFP data; these may be critical to short-term price action on the index.
Don’t miss a beat! Follow us on Telegram and Twitter.
Nasdaq 100 Daily Chart
More content
- Download our latest quarterly market outlook for our longer-term trade ideas.
- Follow Eno on Twitter.
- Do you enjoy reading our updates? Become a member today and access all restricted content. It is free to join.