



- On October 20th, the price of Nvidia (NASDAQ: NVDA) settled at $216.47. This is the end of a five-day price pullback
Introduction
On October 20th, the price of Nvidia (NASDAQ: NVDA) settled at $216.47. This is the end of a five-day price pullback costing approximately $5% to this stock. Stock has pulled back from the $230 range it hit earlier in the month and is now working to assess whether buyers will defend a rising channel that has underpinned the stock since summer.
Our recent look at the Nvidia stock price after the OpenAI revenue update showed how quickly sentiment around AI chips can flip.
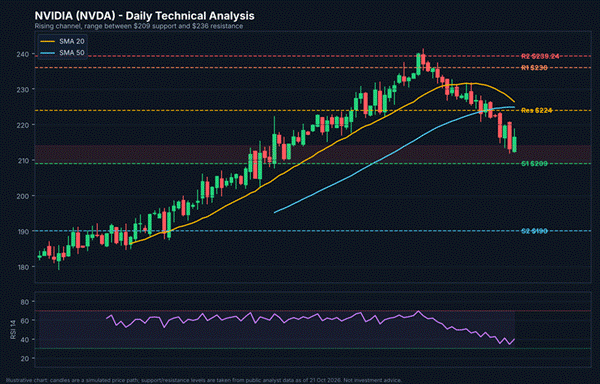
NVDA daily chart with key support and resistance levels, moving averages and RSI (illustrative).
Key Support and Resistance Levels
The chart have a clear range rule. Immediate support lies between $209 and $214, an area that has attracted dip buyers time and time again, as well as the lower band of the channel. A strong close below it would open the door to $200 then the psychological level of $190, which would negate the bigger time-frame uptrend. As mentioned above, there remain two hurdles to overcome on the upside; initial resistance from $224 to $227 and then important supply between $236 to 239, where sellers entered twice already during the recent trading break.
Momentum Indicators
Momentum is weak but still intact. With the 14-day RSI stuck in the high 30s, just shy of oversold conditions, and MACD below its signal line confirming sellers hold a short-term edge.
Weak volume balance points to distribution rather than panic, a pattern we flagged when Nvidia battled market jitters over OpenAI’s chip plans. Short-term averages are sloping lower, so rallies toward $224 are likely to meet supply first.

Catalysts and Scenarios
Fundamentals remain supportive. The collection of all rating shows Wall Street’s consensus twelve-month target is around $329, with nearly every covering analyst giving the shares a buy rate. However, AI sentiment is fragile, as seen when CoreWeave dipped on fresh AI bubble fears, and Nvidia’s earnings report on 18 November is the major event risk.
In a bullish scenario, any daily close above $227 would indicate the correction is over and lead to $236, then $240. Bearish Scenario: A move down and beyond $209 will confirm deeper retracement toward $200 and even the $190.
Until one of those levels gives way, range trading is the base case. For the longer horizon, read our Nvidia stock forecast.
Volume and Risk Management
Volume adds a cautionary note. Price has dropped on above-average volume indicating that selling pressure is still present, while the balance of volume over longer timeframes remains positive. Such a split is typically an indecisive pause, not a false trend reversal. A bullish candlestick pattern, such as a hammer or bullish engulfing candle near $209 to $214 on volume would bring traders into treating the dip as an opportunity. With support, a stop underneath $205 restricts risk and with a target close to $227 it’s sensible first target.
Bottom line:
NVDA is neutral short term, constructive medium-term. With an average daily range of about 2.7%, waiting for confirmation at $209 or $227, and using tight stops might be the best course of action for traders alike. Earnings could always add some volatility so keeping smaller position sizes beforehand would be a smart strategy. The first true sign of short-term momentum shifting would be a close above the 20-day average.