The S&P 500 index is little changed in the futures market as traders reacted to news that a coronavirus vaccine will take longer than expected. It is also reacting to new that the US will ban TikTok on Sunday. The index is trading at $3355, which is higher than yesterday’s low of $3320. The Dow Jones and Nasdaq 100 futures are little changed also. At the same time, the fear and greed index is still at the neutral phase of 53.
Analysts have said that a covid-19 vaccine will be vital for the world to fully recover from the coronavirus vaccine. The vaccine is also part of the reason why the S&P 500 and other indices have rallied recently. However, the vaccine could take a longer period than initially thought, according to a statement by Moderna. The company, which is carrying out tests for its vaccine said that it may not be able to examine data until December if the infection rate continued to slow. The firm also said that its rivals like Pfizer will have to wait for longer to conduct the tests.
The S&P 500 is wavering because of the ongoing crisis over Tik Tok, the fast-growing Chinese app. In an exclusive report, the Financial Times said that the Trump administration had decided to ban the app. The ban will start on Sunday in a decision that will irk Chinese officials at a time when the administration is battling other Chinese firms like Huawei. The administration argues that the app poses a threat to US national security.
Among the top-performing stocks in the pre-market are Apple, Tesla, Nio, and Dave & Busters. Meanwhile, as shown below, the fear and greed index is at 53, indicating that the situation in the market is neutral.

S&P 500 technical analysis
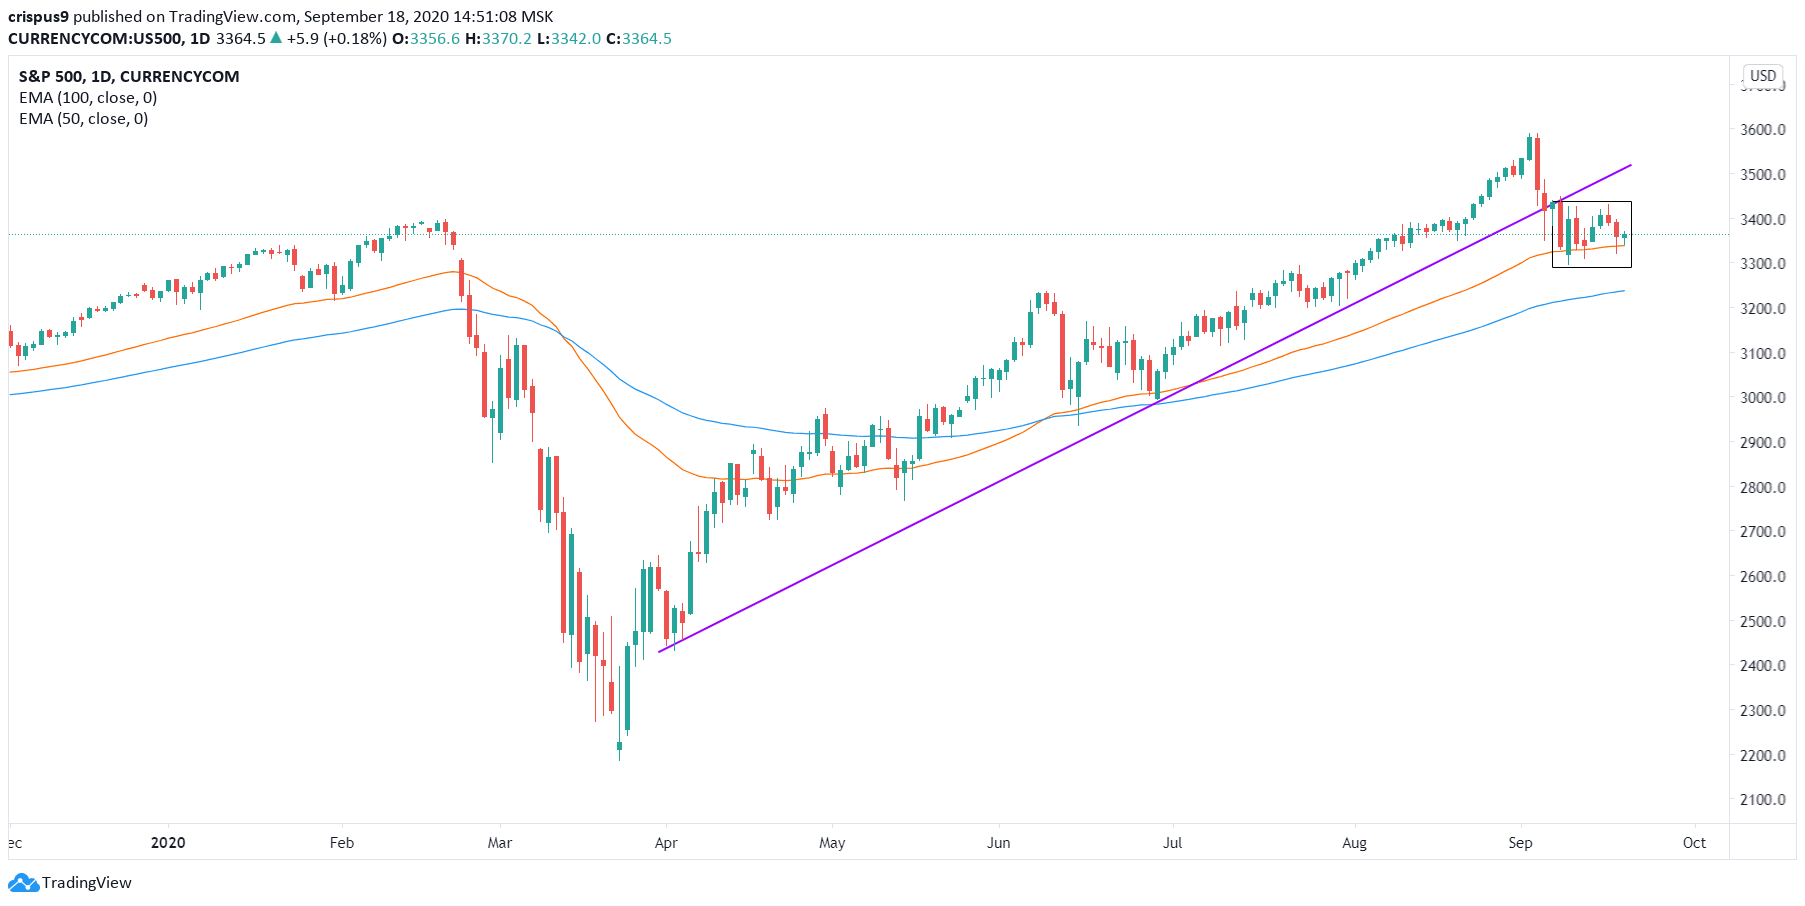
The daily chart shows that the S&P 500 is trading at $3,355, which is below this year’s high of $3585. The price is slightly above the 50-day EMA and above the 100-day EMA. It is also forming a bearish consolidation pattern that is shown in black. In addition, the price is below the ascending trendline that is shown in purple.
Therefore, while the price is in a long-term trend, I suspect that it will move lower in the next few sessions as bears attempt to move below the support of $3200. On the flip side, a move above the important resistance of $3,500 will invalidate this trend.
Don’t miss a beat! Follow us on Telegram and Twitter.
S&P 500 technical chart
More content
- Download our latest quarterly market outlook for our longer-term trade ideas.
- Follow Crispus on Twitter.
- Do you enjoy reading our updates? Become a member today and access all restricted content. It is free to join.