

- Explore the S&P 500's post-breakout structure and analyze how TSLA and BA earnings releases could impact its momentum.
The S&P 500 is trading near the 7,100 level, signaling that US stocks are once again close to an all-time high this Tuesday. This rally is being driven by a sharp decline in energy prices, linked to growing optimism around progress in US-Iran peace talks.
Additionally, mega-cap tech companies adding more than $4 trillion in market value are supporting the index. Further gains may follow tomorrow during “Super Wednesday,” a $2 trillion showdown, as Tesla (TSLA) and Boeing (BA) release their Q1 earnings.
TSLA and BA are among the main US stocks. If both report poorly tomorrow (Wednesday), it would trigger a “risk-averse” sentiment. This will push the S&P 500 down to test the 7,100 support or even the 7,000 psychological floor.
Since Tesla is a major component of the consumer discretionary sector, it makes up about 10% of the S&P 500. Hence, a massive move in TSLA often affects the entire sector and the index with it.
Post-Breakout Structure: Can the S&P 500 Sustain Momentum?
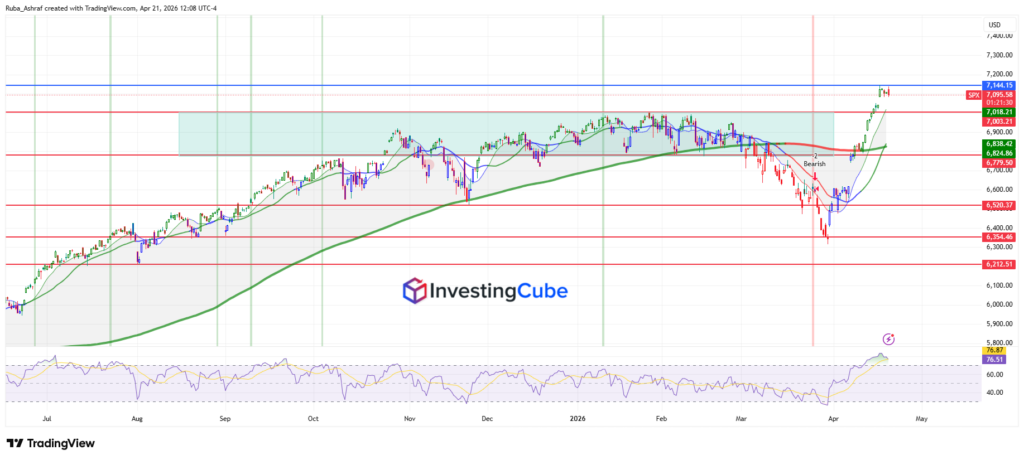
This week, the S&P 500 successfully broke above the rectangle consolidation pattern as we expected in our latest technical analysis. The index is now holding above the upper boundary of that range while testing the all-time high around 7,144 and attempting to push beyond it.

Looking at the 4-hour chart, the breakout is marked by a strong, parabolic recovery following the bearish -2 signal in late March. The index has reclaimed all major averages and is now showing significant momentum. Meanwhile, the longer-term MA (green) is also curving upward, confirming that the broader trend remains bullish.
On the RSI, the indicator is hovering in the overbought zone near 70-77. This signals strong bullish momentum but also raises the probability of a short-term pullback or consolidation before any further upside continuation.
The upcoming earnings from Tesla and Boeing will likely act as the fundamental trigger for one of the following technical paths:
- Bullish Continuation (Primary Scenario): If price holds above the 7,000–7,030 support zone, the breakout remains valid. A sustained move above 7,144 could open the door for further upside, potentially pushing into new all-time highs. In this case, the market is likely entering a continuation phase of the broader uptrend.
- Short-Term Pullback (Healthy Correction): Given the overbought RSI and the sharp rally, a pullback toward the breakout zone (around 7,000 or even 6,880) would be technically healthy. As long as the price holds above the top of the previous rectangle, the bullish structure remains intact.
- False Breakout / Rejection: If the index fails to hold above 7,000 and drops back inside the rectangle, this would signal a false breakout. That could lead to a deeper correction toward 6,780 or even 6,520, where stronger support levels are located.
Strong earnings from Tesla and Boeing could support the index and push it higher, while disappointing results may trigger short-term volatility or a pullback.
Because both companies are major market drivers, their results give insight into key sectors, tech and industrials, and can influence overall investor confidence.
