

- A 10% surge in 11 days historically leads to a 35% median annual return, suggesting that current price action is a powerful "momentum thrust" rather than just a temporary spike.
- This rare bullish signal is currently reinforced by geopolitical de-escalation and resilient Q1 2026 earnings
The S&P 500 index ticked higher by 0.80%, or 55.57 points, fueled by the optimistic sentiment regarding the US-Iran peace. Besides, investors’ focus shifted to companies’ Q1 earnings reports. The index has rebounded sharply from its March 30 eight-month low, rallying to close above 7,000, its record high. Tech, consumer cyclicals, and positive bank earnings also boosted U.S. equities.
On Thursday, investors grew more confident that the conflict in the Middle East had passed. Despite the lack of a deal, hopes for diplomatic progress are boosting sentiment. This renewed appetite for risk assets led the benchmark S&P 500 and Nasdaq to close higher yesterday. Another factor supporting sentiment is that Israel’s cabinet met on Wednesday to discuss a possible ceasefire in neighboring Lebanon, according to a senior Israeli official.
S&P 500 Technical Analysis | Breakout Attempts Signal Further Upside:
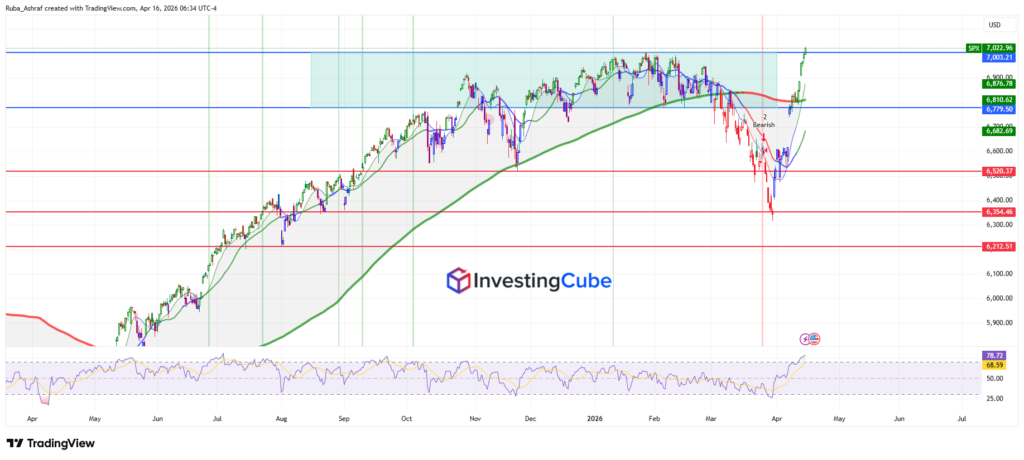
The chart shows a strong recovery following the sharp selloff, with price reclaiming key levels in a structured way. After the decline, the index found support and began forming higher lows, indicating a shift in momentum.
The key turning point came when the price broke above the lower boundary of the rectangle consolidation zone. This move signaled that buyers were stepping back, allowing the market to successfully retain its bullish momentum.
Since then, prices have continued to trade higher, supported by short-term moving averages that push upward and steady improvements in structure. Now, the market is pushing toward the upper boundary of the rectangle, attempting a breakout. This is a crucial juncture: a sustained move and stabilization above this upper range would confirm the continuation of the bullish trend and pave the way for further upside.

The RSI is moving into overbought territory, which reflects strong buying pressure but also suggests the possibility of short-term consolidation. Overall, as long as the price holds above the breakout zone (previous resistance turned support), the bias remains bullish.
Historical S&P 500 Performance Following Rapid 10% Rallies:
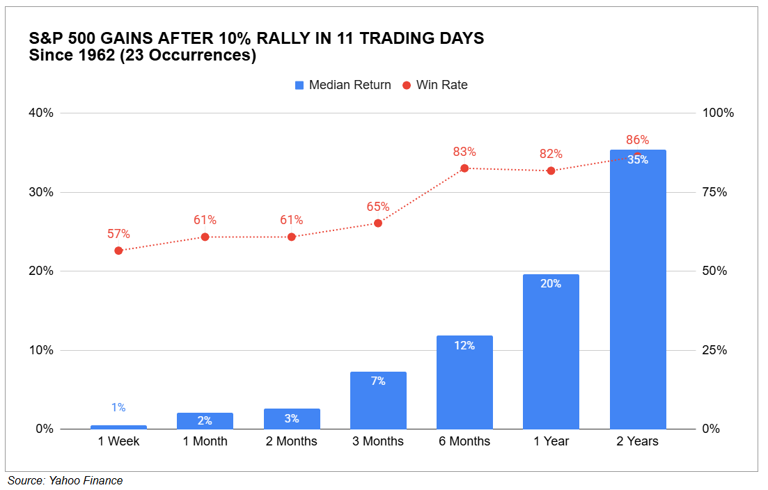
This chart shows what usually happens after a rare bullish signal, when the S&P 500 rises 10% in just 11 days. While such sharp moves may make the market look overbought in the short term, history suggests they often mark the start of a longer-term uptrend rather than the end of a rally.
In the short run, returns are modest, with about a 1% gain after one month. However, the chances of profits increase over time, reaching around 83% after six months and 86% after one year. On average, the market delivers a strong 35% return over the following year.
In simple terms, even if the market pauses after such a move, this kind of strong momentum usually leads to further gains over the longer term.
Because the short-term win rate is lower (around 57%), the risk of a “bull trap” is highest in the first 30 days. Many technical strategies use the low point of the 11-day rally period as a definitive stop-loss level. If the index closes below the starting point of that 10% surge, the “thrust” has failed.
Historically, the most successful entries occur when the market successfully tests its 20-day exponential moving average (EMA) without breaking it during that initial one-month cooling-off period.
To tell if a strong move is real and not just a short spike, analysts look at how many stocks are participating in the rally.
A true signal happens when a large number of stocks, not just a few big tech names, move above their 50-day or 200-day averages at the same time.
Another sign is the RSI. If the market rises 10% while the RSI is moving up from oversold levels, it suggests the start of a new upward trend, not just a temporary bounce.