


- S&P 500 futures surged toward 6,803, tracking a positive start for Wall Street alongside the Dow and Nasdaq.
- Analysts at JPMorgan have predicted that a sustained Iran conflict could drive oil beyond $100, potentially triggering a 10% tumble in the S&P 500.
Wall Street is staging a sophisticated counter-rally this Tuesday, as the S&P 500 attempts to decouple from the dire geopolitical narratives that dominated the previous week. While institutional heavyweights like JPMorgan are signaling a potential double-digit drawdown, the market’s immediate response to easing Middle East tensions suggests a resilience that many bear-market theses may have underestimated.
Stock Market Relief Rally as Iran-Israel Tensions Ease
The narrative on the trading floor has shifted from “war footing” to a tactical relief rally. As U.S. President Donald Trump hinted at an accelerated end to the Iran-Israel conflict, the catastrophic “supply shock” scenario has, at least temporarily, evaporated. This cooling of rhetoric has allowed the S&P 500 to breathe, particularly in the technology and discretionary sectors which are most sensitive to energy-driven inflation.
However, the “smart money” remains focused on the structural risks highlighted by JPMorgan. The bank’s warning, that a 10% correction is a high-probability event if oil sustains triple digits, serves as a reminder that the current rally is highly dependent on diplomatic stability. If the Strait of Hormuz remains a flashpoint, today’s gains could prove to be a “bull trap” in a broader corrective cycle.

S&P 500 Technical Analysis Today
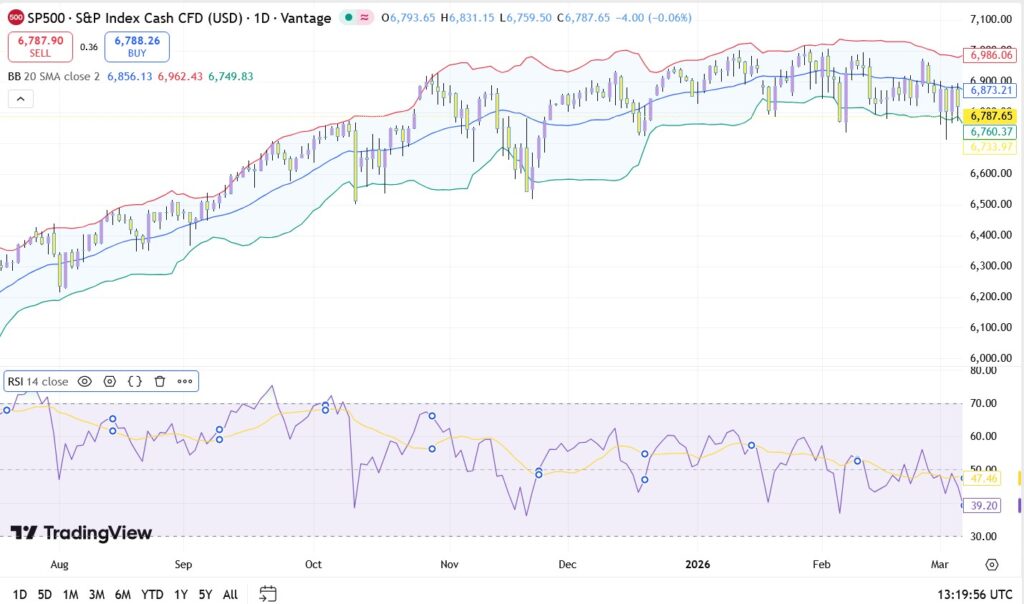
From a technical standpoint, the S&P 500 is currently undergoing a “stress test” of its medium-term trend.
- Resistance: The index faces immediate overhead pressure at the 20-period SMA (6,856). Reclaiming this level on a closing basis is the “must-have” signal for a sustained recovery.
- Support: The 6,749 level (lower Bollinger Band) has emerged as a formidable floor. A failure to hold this zone would likely validate JPMorgan’s bearish thesis and accelerate a move toward the 6,100 region.
Conclusion: A Tactical Window of Opportunity
For the discerning investor, Tuesday’s price action represents a tactical window. The S&P 500 is effectively caught between a relief rally and a potential structural shift. While JPMorgan’s 10% correction warning cannot be ignored, the index’s ability to hold the 6,750 support amidst geopolitical chaos is an encouraging sign of underlying strength.
Until the 6,856 resistance is reclaimed, a selective approach with strict risk management remains the most prudent strategy for navigating the 2026 market landscape.