
- The expiration of the Middle East ceasefire on Wednesday evening is the critical pivot point; a breakdown in talks could trigger a breakout toward $4,860, while a diplomatic success may push prices toward the $4,600 value zone.
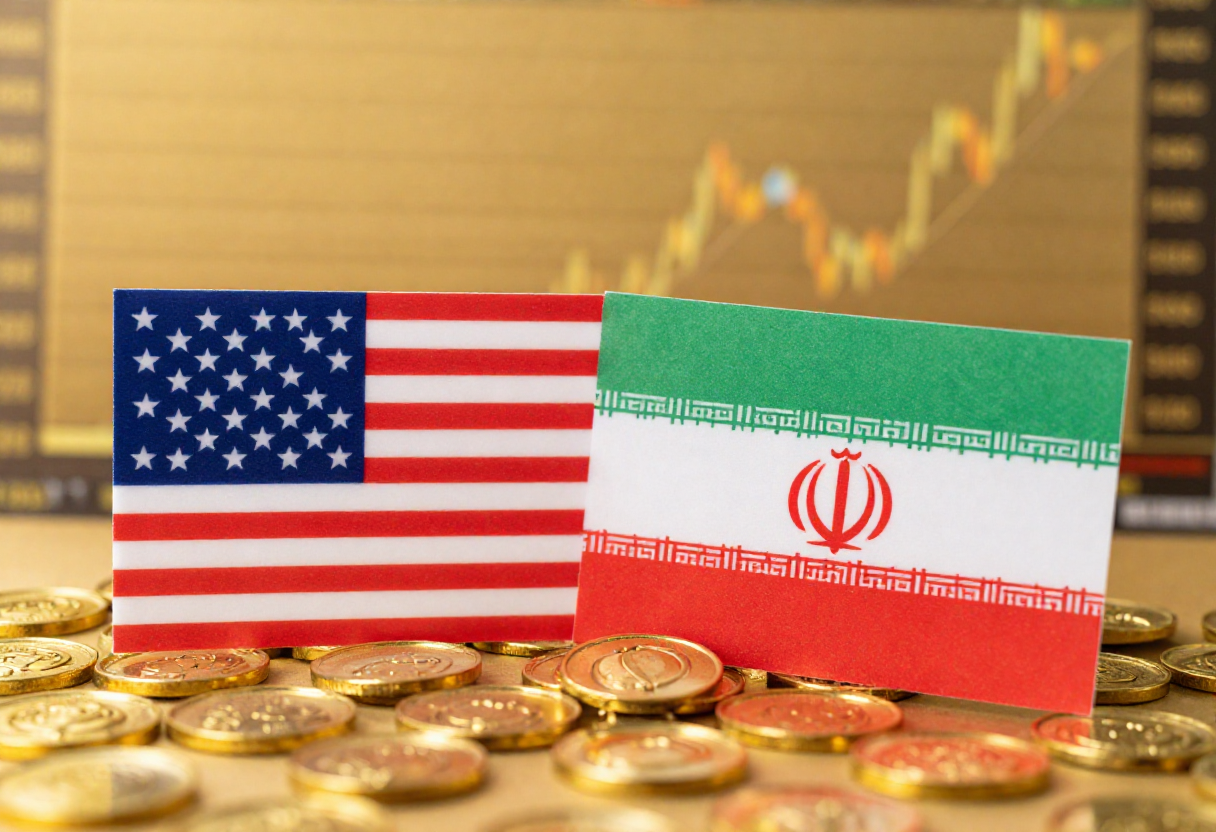
Gold price falls on Tuesday due to a stronger U.S. dollar. Investors are cautious and closely watch US-Iran talks and ongoing risks around the Strait of Hormuz. The spot gold price is down by 0.83%, or 40.83 points, as of 12:41 GMT+2. Gold futures for June delivery fell 0.5% to $4,804.70.
This decline in gold prices reflects concerns over potential escalation in the Strait of Hormuz, as the situation remains uncertain. The blockage is still in place; however, the recent drop in oil prices does not rule out further increases if talks fail again.
Additionally, this uncertainty is keeping inflationary concerns elevated, supporting a stronger US dollar, which is acting as a headwind for gold. However, any strong rise in the US dollar seems unlikely as expectations for a Federal Reserve rate hike continue to fade. Markets are pricing in a roughly 45–50% chance of a Fed rate cut by year-end, according to the CME Group’s Fed Watch Tool.
On the US–Iran talks developments: A Key Driver of Gold’s Cautious Price Action
- Donald Trump said US negotiators will travel to Pakistan for another round of talks with Iran.
- The goal is to extend the fragile ceasefire, which is set to expire on Wednesday.
- Iranian officials remain cautious about further negotiations, citing the ongoing US blockade.
- Mohamed Bagher Ghalibaf stated that Iran will not negotiate while under threat.
- Abbas Araghchi said repeated ceasefire violations by the US are a key obstacle to progress.
- Despite tensions, reports indicate that an Iranian delegation may still travel to Islamabad for talks.
With that, let’s take a technical look at gold price action, highlighting the potential scenarios for the yellow metal ahead.
Gold Price Technical Outlook | Breakout Holding or Reversal Emerging?
Last week in my gold technical outlook, I highlighted that a breakout was emerging due to the triangle pattern forming on the chart. That’s where we stand now. However, the bullish breakout is currently being capped by mixed sentiment in the market.
Looking at the current price structure:
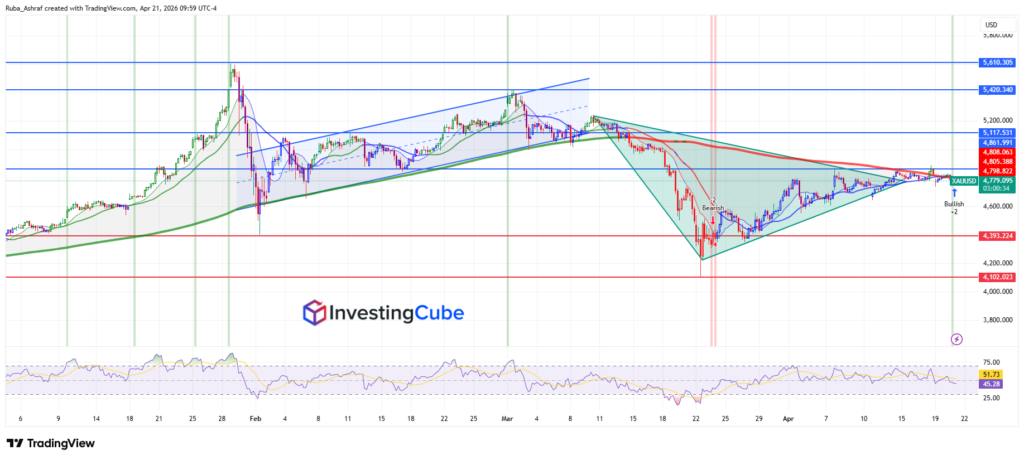
Gold is still trading inside a broader symmetrical triangle formation, following a strong downside impulse and a gradual recovery phase. Gold’s price action shows repeated attempts to break above the upper boundary of the consolidation zone, but upside momentum is weakening near the 4,800-4,810 resistance area, where sellers are consistently stepping in.

On the indicator side, the moving averages are flattening, reflecting indecision rather than a clear trend. Short-term averages are starting to cluster around the price. When these averages transition from a widespread to a thin line, it typically indicates a transition phase rather than directional strength. It also confirms that market volatility has temporarily dropped.
The RSI is hovering in the mid-zone (50), indicating a lack of control from both sellers and buyers. This confirms the current balanced but fragile market structure.
From a price action perspective, the chart shows the following:
- Strong resistance zone: 4,800 – 4,808
- Intermediate resistance: 4,860
- Key support levels: 4,770 – 4,750
- Major downside support: 4,600, followed by 4,393 and 4,102
Since the ceasefire deadline is Wednesday evening, expect the 4,750 support to be tested multiple times. If it holds, we could see a squeeze back toward your 4,860 resistance.
Potential Scenarios for Gold Price Movements:
- Bullish Scenario (breakout continuation): A decisive daily close above the 4,810-4,860 resistance zone would validate the bullish breakout from the triangle. This could pave the way for a continuation toward higher levels, as momentum traders re-enter the market and stop orders are triggered above resistance.
- Bearish Scenario (false breakout/rejection): If price fails to hold above resistance and gets rejected again within the triangle structure, gold could slip back toward the mid-range support around 4,750-4,700. With deeper downside risk toward 4,600 if selling pressure increases.
- Range-bound scenario (most likely in current conditions): Given the mixed macro sentiment, gold may continue to consolidate inside the triangle, with choppy price action until a clear macro catalyst (Fed expectations, USD strength, or geopolitical escalation) drives a decisive breakout.
Keep a close eye on the $4,800 mark. Stability above this psychological round number is the bare minimum requirement for the bulls to maintain control of the narrative this week.
Normally, when tensions rise between the US and Iran, investors rush into “safe-haven” assets like gold. But right now, we’re seeing something different. Instead of gold, investors are mainly buying the US dollar as their safe place.
At the same time, oil prices have jumped sharply. This raises concerns that inflation could stay high for longer.
Because of that, markets now expect the US central bank to keep interest rates higher for an extended period. Higher rates make gold less attractive since it doesn’t earn interest. As a result, gold is temporarily losing some of its usual appeal as a safe-haven asset.
Most analysts see this as a structural reset, not a bear market. Despite pulling back from 2026 highs near $5,600, gold is supported by strong central bank demand from countries like Poland, Uzbekistan, and China, which are expected to buy over 800 tonnes this year.
As long as gold holds above the $4,600–$4,750 support zone, the long-term uptrend remains intact. The current sideways action is mainly the market consolidating recent gains while waiting for clearer signals on interest rates and geopolitical developments.