
- While war fears provide a "safety floor" for prices, the upcoming results of the Islamabad talks and the U.S. naval blockade will determine if gold climbs toward $5,000 or drops to test the $4,393 support.
The spot gold price opened at $4,746.92 per ounce, higher than the previous close of $4,740. A softer USD supported gold, allowing it to hold above its Monday losses amid optimism that the United States and Iran may reach a permanent ceasefire, despite the lack of a clear agreement after the first round of talks in Pakistan.
Meanwhile, US inflation data came in at 3.3%, as expected. Initially, the report supported the USD, as such data increases the probability that the Federal Reserve will keep interest rates unchanged or even raise them. However, oil prices later declined amid improving US–Iran sentiment and the passage of a third Iran-linked tanker through the Strait of Hormuz. As a result, these developments weighed on the US dollar.
Gold benefited from the weaker dollar and moved slightly higher; however, mixed market sentiment continued to cap its gains. Additionally, US President Donald Trump announced a blockade on Sunday after failing to reach a deal during the Islamabad talks.
Let’s take a technical outlook on the gold price before diving into the key developments of the US-Iran talks.
Gold Price Technical Outlook | Is a Breakout Approaching?
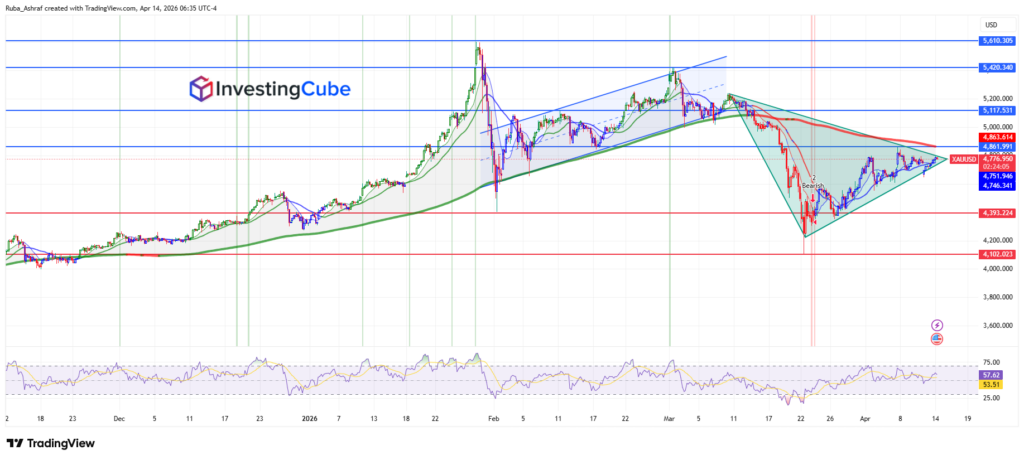
Gold initially followed a strong bullish trend, supported by a steady series of higher highs and higher lows. Once the price reached the major resistance zone around the 5,400 level, strong selling pressure emerged, leading to a sharp rejection and signaling a potential trend reversal.
Following this rejection, the market structure shifted from bullish to bearish. Price broke below the ascending trendline and started forming lower highs, confirming weakening momentum. The large green symmetrical triangle currently defines a narrowing technical “squeeze” in the market, as shown in the provided 4-hour chart.
The price is currently oscillating around the $4,782 level, which sits right in the middle of a dense support/resistance cluster between $4,746 and $4,861. This price action indicates a temporary equilibrium between buyers and sellers as the market awaits a fundamental catalyst to force a breakout from this triangle pattern.

This triangle structure suggests that a breakout is approaching. A break above the descending resistance could signal a continuation of the recovery toward the 4,900–5,100 resistance zone.
On the downside, a breakdown below the rising support may lead to renewed selling pressure, with the price potentially revisiting the 4,400 and 4,100 support levels. From a momentum perspective, the RSI is moving in the mid-range, reflecting neutral conditions. This aligns with the current consolidation phase, where neither buyers nor sellers are in control.
Key US–Iran Developments Shaping Global Markets:
- The Islamabad peace talks took place over the weekend of April 11-12. The I.S. delegation included Vice President J.D. Vance, Steve Witkoff, and Jared Kushner. The talks reportedly ended without a clear deal. The key obstacles to reaching a final deal were:
- The U.S. is demanding a total halt to uranium enrichment for 10 years.
- The U.S. requires an immediate reopening of the Strait of Hormuz for global oil flow. On the other hand, Iran reportedly struggled to clear mines it planted during the conflict.
- Officials are currently thinking about holding another round of negotiations.
- President Donald Trump announced a naval blockage of Iranian ports effective April 13.
- Trump issued a warning that any Iranian boats approaching the blockade would face destruction.
- The UK and France are scheduled to co-host a conference this Friday (April 17) to discuss a “defensive mission” to restore freedom of navigation.
While the conflict provides a “safe-haven” floor, the U.S. dollar is currently very strong due to high inflation data. Since gold is priced in dollars, a stronger greenback makes the metal pricier for global buyers, which acts as a “ceiling” that prevents the price from skyrocketing even during geopolitical tension.
The triangle pattern shows a market in “wait-and-see” mode. The upper line represents the ceiling created by high interest rates and hopes for peace, while the lower line represents the floor created by war fears. As the price moves toward the tip of the triangle, it indicates that a major decision is coming: either a breakout on news of renewed conflict or a breakdown if the Islamabad talks finally succeed.