
- Lloyds Bank stock rebounded in April, gaining over 10% and seemingly securing support at 100p
- The key market movers in 2026 have been BoE interest rates, and, recently, the geopolitics around US-Israel vs Iran war
- 100p is a critical psychological and technical support, with buyback disclosures indicating the bank has been buying in the 100.5p-105p range
Following a notable downturn in February and March, during which its value approached the 200-day moving average, Lloyds Bank share price has experienced a strong rebound, rising by more than 10% this month. As of this writing, London Stock Exchange data indicates the shares are trading near 103p, prompting renewed discussions on whether the 100p mark could now serve as a lasting support level.
From 114p to the 200-day Moving Average and Back
The reasons for this decline were apparent. Lloyds shares reached a 2026 peak of 114.6p on February 4th. Subsequently, geopolitical tensions stemming from the Iran conflict led to a significant market sell-off, driving the price down to 92.34p by the close of March. This amounted to approximately a 20% decrease from its highest point.
However, April brought fresh buying activity, with the shares momentarily reaching 105.12p on April 17th before stabilizing near present values. This market adjustment was not isolated, impacting the broader sector. NatWest experienced a drop of more than 15% in March, and Barclays saw a comparable reduction.
These movements were influenced by developments in the Middle East conflict and an increase in UK gilt yields. Given its primarily domestic market focus, Lloyds was naturally affected by these broader trends.
Will 100p Support Hold?
The 100p mark has emerged as a psychological and technical floor. In early April the shares tested this area multiple times, bottoming near 99p, before rebounding. Traders seem to view this level as a credible support, especially since there was a significant uptick in buying volume when it dipped.
Still, nothing is absolute. Should sentiment turn sour over inflation rising too fast or interest shifts, falling below 100p might open the door to go straight back toward the March lows of 87-92p.
The significance of the 100p level extends beyond a mere round number, underscored by Lloyds’ own actions concerning it. Disclosures on buybacks, lodged with the London Stock Exchange, indicate that the company has been repurchasing one million shares each day within the 100.5p to 105p range, facilitated by Goldman Sachs International.
This represents more than passive confidence. It reflects capital actively deployed at precisely the valuation investors are scrutinizing. When management implements its own buyback program at 100p, this support level takes on a commercial dimension that goes beyond what pure technical analysis might reveal.
Peer Comparison: Barclays and NatWest
Lloyds’ performance should also be viewed in the context of its peers. Barclays, for instance, has experienced a comparable trajectory, with shares closing around 452.85p on April 17th after its own post-February correction.

Meanwhile, NatWest is trading close to 626p. While all three institutions have benefited from similar narratives around Bank of England (BoE) interest rate tailwinds, it is important to acknowledge their distinct characteristics.
Analysis from The Motley Fool UK highlights the valuation landscape clearly. Barclays exhibits a Price-to-Earnings (P/E) ratio of approximately 9.9, and NatWest around 9, whereas Lloyds carries a valuation premium, trading at roughly 13.3 times its earnings.
Barclays gains from a more diversified investment-banking segment, which has proven beneficial in navigating domestic economic challenges. NatWest, on the other hand, offers a higher projected dividend yield, with forecasts estimating around 5-6 percent. Also, analysts’ previews suggest a slightly stronger Q1 momentum.
Lloyds consequently trades at a modest premium when considering valuation metrics, which may reflect its more focused exposure to the UK retail banking sector.
Lloyds Bank Share Price
Lloyds Bank share price RSI at 57 indicates control by buyers. The pivot mark is at 102p and action above that level favours the upward momentum. To maintain its trajectory, the stock must overcome immediate resistance at 103.60p. A breakout here opens the door to test 105.25p in the near-term and the February peak of 114.6p in the coming weeks. The first meaningful support is at 101.05, with the second one at psychological 100p. A daily close below this level would signal a bearish reversal toward 90.6p.
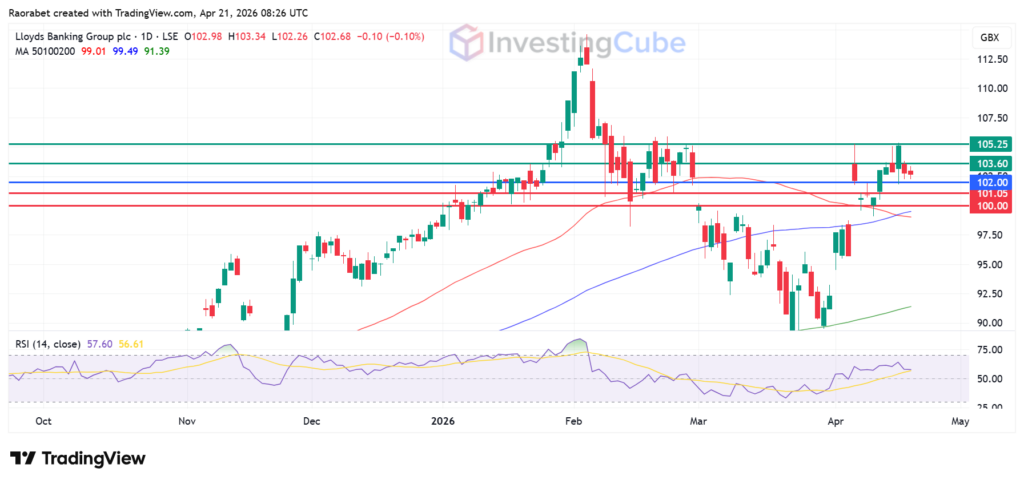
Lloyds share price daily chart with the key levels of support and resistance on April 21, 2026. Created on TradingView
From a technical perspective, the 100.9p level functions as the current pivot point. Although buyers are actively defending this area, a breach could potentially lead to the stock declining towards its 200-day moving average, positioned around 90p.
NatWest trades at a lower P/E of around 9 versus Lloyds’ 13.3 and offers a superior dividend yield of approximately 6% against Lloyds’ 4%. Based solely on present valuation metrics, NatWest might appear to be the more compelling opportunity.
The April rebound is encouraging, yet sustainability depends on net interest margins and cost control. Analyst targets imply further upside to around 113p, but Lloyds’ heavier UK retail exposure makes it more sensitive to domestic slowdowns than peers. Execution on buybacks and dividends will be key.