FTSE 100 index (INDEXFTSE: UKX) is showing some signs of weakness after breaking above 8000 points a few weeks ago. On Friday, 9th March, FTSE 100 lost 35 points in the afternoon. Till press time, the benchmark UK Index was trading at 7921 points after losing 0.43% since yesterday.
The global equity markets are in turmoil as inflation is escalating at a very alarming rate. The most recent US inflation data has revealed that despite an increase in rates, PCE core inflation is still rising. This unexpected surge in the US Federal Reserve’s preferred inflation gauge has sent S&P 500 below 4000 once again. Consequently, the rally in UK equities that started in the first week of January is also stalling.
What Is The FTSE 100 Today?
FTSE 100 index bottomed at 6706 in October 2022 and has been in an uptrend since then. The price has gained 18% during this time due to a strong outlook of the FTSE 100 companies. This strong uptrend was also supported by a corresponding uptrend in the US equities. INDEXFTSE: UKX is trading at 7921 after showing a negative price action.
Many analysts were expecting a Fed pause in rate hikes sooner rather than later this year. However, February’s CPI and PCE inflation stats threw these expectations out of the window. As a result, financial giants like Goldman Sachs and Bank of America are forecasting at least another three rate hikes this year. This will likely put the terminal rate within the 5.25%-5.5% bracket.
FTSE 100 Index Chart
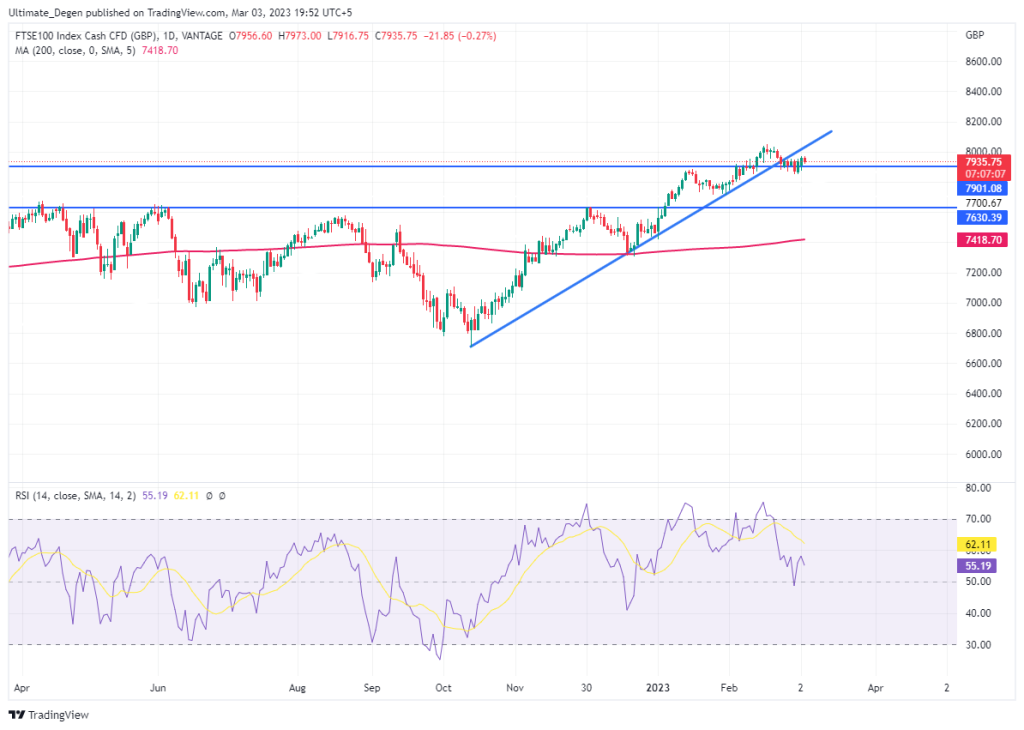
The following chart reveals a few critical levels to watch on the FTSE 100 chart. The major level to watch is the psychological barrier of 8000 points. Although the price broke above this level in February but dipped below after fondling around it for a few days.
Another critical level to look for is the 7933 points level which was the 2018 all-time high. At the moment, the price is trading above this level. A few daily closures below this level can tank the price to the 7635 level, which has previously acted as a strong resistance. FTSE 100 forecast will become extremely bearish if the price loses this level, as the next support lies at 200-day MA. The 200-day moving average currently lies at 7418.