



- Bitcoin fell 6% to about $68,700.
- Support $67,000; resistance $70,000 then $73,400.
- Watch Nvidia on 17 November and the Fed on 9 December.
- 1$67,000.00 200-week moving average · SupportNext floor below current price; a weekly close below opens deeper slide.
- 2$70,000.00 Broken support · ResistanceFormer support that broke down; bulls must retake it for upside momentum.
- 3$73,400.00 200-day average targetFirst bullish target above $70,000 inside the 200-day moving average resistance.
- 4$76,000.00 Options max pain · ResistanceMaximum pain level for options and second bullish upside price target.
- 5$100,000.00 Standard Chartered targetStandard Chartered reduced its year-end Bitcoin price target to $100,000.
- 6$125,000.00 Bernstein targetBernstein lowered its Bitcoin price estimate to $125,000.
TradingView Lightweight Charts™ · Binance data
Friday the 13th has lived up to its name. Bitcoin fell more than 6% in 24 hours. It now trades near $68,700. That is its lowest since August, says Crypto.com. It is also down about 15% in a month. Is the bottom nearby? Check the chart. Bulls have little good news today.
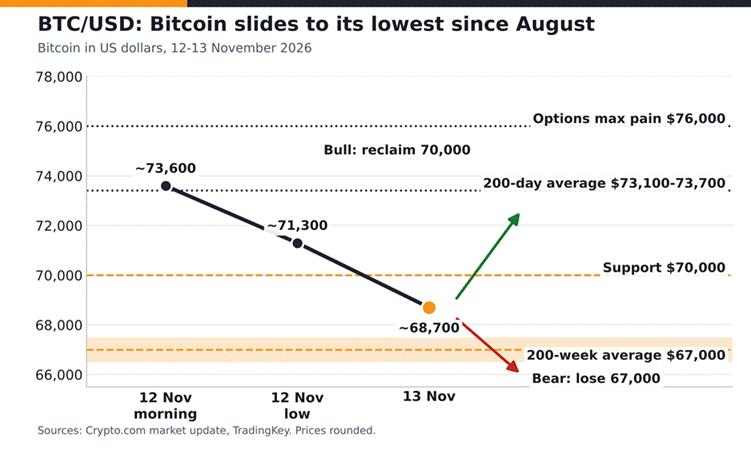
Figure 3: Bitcoin in US dollars, shown in Bitcoin orange and charcoal. Data as of 13 November 2026.
What the Chart Shows
The black line on the chart shows that as of Thursday morning, Bitcoin was trading at about $73,600. By Thursday’s low, it was down to approximately $71,300. Today, Bitcoin is being traded around $68,700, which is represented by the orange dot on the chart. Above the price level of Bitcoin, there are several dotted lines that represent resistance. The 200-day moving average for Bitcoin is between approximately $73,100 and $73,700. In addition, the maximum pain level for options is at approximately $76,000. Prior to today, $70,000 acted as a level of support. However, this has broken down.
Below the current price level of Bitcoin, the next floor is represented by the orange band on the chart. This band contains the 200-week moving average at approximately $67,000. For bulls to continue their upward momentum, they need to regain control over $70,000. For bears to continue their downward momentum, they need to close out the week below $67,000. Simple rule: until bulls’ retake $70,000, rallies are suspect. Bitcoin trades with tech stocks, and our Nasdaq 100 report shows how to spot a dead cat bounce.
Three Reasons for the Drop
First, inflation. October US prices rose 0.4% in the month. Economists expected 0.3%. Core prices rose 0.3% against 0.2%. See the full report at the Bureau of Labor Statistics. Traders now give a 25-point Fed hike about 87% odds for December. Fed governor Christopher Waller floated a half-point rise. That is a double dose of bad news for risk assets. Our S&P 500 forecast shows how stocks sold off earlier this month.
Second, Nvidia lost its chief executive. Jensen Huang resigned, and tech shares fell. Third, money is leaving Bitcoin funds. US spot ETFs lost $299.9 million on 11 November. That was five outflow days in a row, about $1.44 billion. Track Fed odds on the CME Fed Watch tool. Our gold report shows how metals reacted to the same jitters.
Key Dates Ahead
Momentum looks weak. On Thursday the RSI sat near 34 and the MACD was negative. That means sellers still lead. Oversold readings can bring sharp bounces too. Mark these dates. Nvidia reports on 17 November. Fed minutes come on 18 November. The next Federal Reserve decision is on 9 December. Asia felt the same stress. Our Nikkei 225 forecast shows a market in a bear phase.

Trade Plans
- Bullish: a close above $70,000 targets $73,400, then $76,000.
- Bearish: a close below $67,000 opens a deeper slide.
- Neutral: a range between $67,000 and $70,000.
As we head into the next few days, we could see some big swings in the market. There are approximately $2.48 billion of options expiring today. However, the long-term view of many major banks is becoming more pessimistic. Standard Chartered, for example, has reduced its target price for Bitcoin from $150,000 to $100,000 by year-end. At the beginning of 2021, Bitcoin was trading at about $87,500. Bernstein also lowered its estimate to $125,000. It is impossible to know when the bottom will occur; therefore, you should prepare for both upside and downside scenarios. You also need to check what price your trading platform shows because different data feeds provide slightly different prices. Finally, do not use funds that you cannot afford to lose. Start out trading smaller amounts, and when you begin making profits, start taking those profits in increments. A positive economic report can quickly eliminate any momentum built up during a previous rally. Maintain control of yourself. Be patient and disciplined with yourself. Always use a stop loss order. Are you going to buy on weakness or wait until Bitcoin hits $70,000?
Frequently Asked Questions
Why did Bitcoin drop today?
Bitcoin has dropped more than 6% within the last 24 hours, due to a combination of factors including higher than expected US inflation, the prospect of further interest rate increases from the Federal Reserve, the departure of Nvidia’s CEO and an increase in exchange traded fund (ETF) outflows.
What is the key Bitcoin support?
$70,000 failed. The next floor is the 200-week average near $67,000.
What is the key Bitcoin resistance?
Near the $73,100 – $73,700 level lies the 200-day moving average. The next point of interest for options max pain is around $76,000.
What is your outlook on Bitcoin?
Anonymous · no sign-up · results from the last 30 days · not investment advice