



- Ethereum price extended its strong sell-off as the Crypto Fear and Greed Index dropped.
- Spot Ethereum ETF outflows have accelerated this month.
- The coin is about to form a death cross pattern on the daily chart.
Ethereum price continued its strong sell-off and lost a crucial support level as the Crypto Fear and Greed Index dropped to the extreme fear zone, triggering a wave of selling in the spot and derivatives markets. ETH plunged to $1,900, its lowest level since August 19, and 31% below its highest point in September.
Ethereum Price Drops as Fear Spreads
ETH token has been in a strong sell-off in the past few months, and the situation is getting worse. The Crypto Fear and Greed Index has dropped to the extreme fear zone of 18, its lowest level in over a month. This trend accelerated after the US midterm elections, in which Democrats won the House of Representatives and the Senate.
Also, the trend accelerated after the US published strong macro numbers. A report showed that the unemployment rate dropped to 4.1% as the economy created 165k jobs last month. Inflation has also risen, raising concerns that the Federal Reserve will hike interest rates.
American investors have continued dumping their ETH ETFs. Data shows that spot ETH ETFs lost over $330 million in assets this week. In total, the funds have lost over $695 million in assets after losing $1.6 billion last month. They now hold over $11.5 billion in assets under management.
The same trend is happening in the futures market, where the open interest has continued falling. Data shows that the futures open interest has plunged to $23.9 billion, much lower than $36.2 billion in August. The falling open interest is a sign that demand among speculators is fading.

At the same time, liquidations have continued to accelerate. Ethereum positions worth over $289 million were liquidated in the last 24 hours. In total, liquidations in the crypto industry surged by 510% to $1.64 billion.
ETH Price Technical Analysis
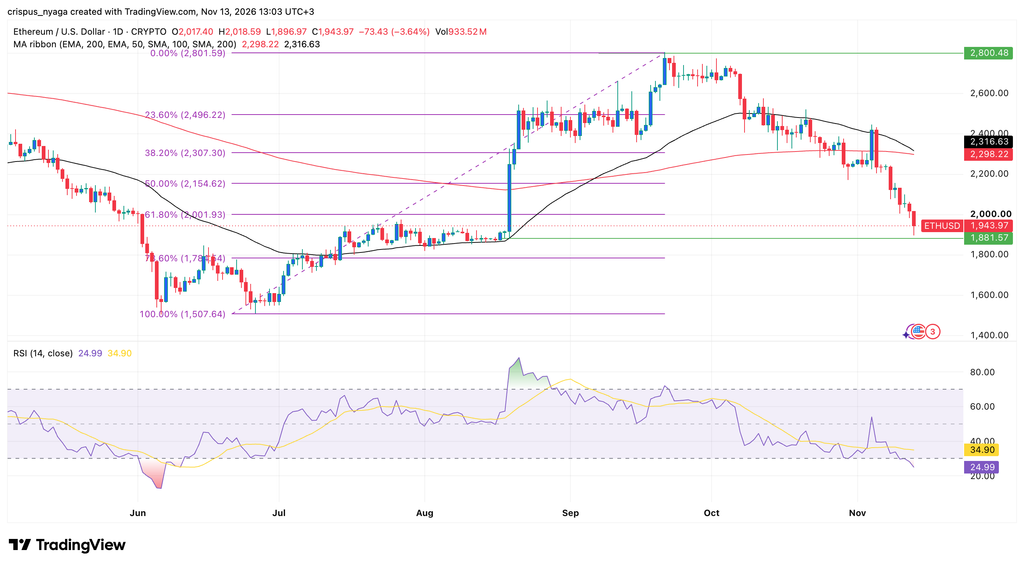
Ethereum price chart | Source: TradingView
The daily chart shows that the ETH price continues its strong downward trend and is now trading at its lowest level since August 19. It has dropped below the crucial support level of $2,000, which coincides with the 61.8% Fibonacci Retracement level.
Most notably, it is about to form a death cross as the spread between the 50-day and 200-day moving averages has narrowed. The Relative Strength Index (RSI) has continued falling and is now in the oversold level.
Therefore, the token has more downside to go, potentially to the 78.6% retracement level of $1,785.
What is your outlook on Ethereum / US Dollar?
Anonymous · no sign-up · results from the last 30 days · not investment advice