
- With the RSI resting neutrally at 53.56, the market is in a balanced consolidation phase, waiting for a decisive breakout above 4,633.11 to confirm a bullish reversal or a breakdown below 4,489.14 to resume the broader downtrend.
- Escalating Middle East tensions traditionally boost gold as a safe haven, but the resulting surge in energy prices fuels inflation fears, threatening higher interest rates that ultimately check gold's upside.
Gold price finds support on Tuesday from the lower treasury yields and the fragile ceasefire between Hezbollah and Israel. Moreover, traders are cautious for more details on any new updates about the U.S.-Iran peace talks.
Spot gold advances 0.96%, or 43.26 points, as of today at 14:45 GMT+3, trading around $4,527.53 per ounce. Gold futures edge higher by 1.14%, or 51.2 points, as of today at 14:37 GMT+3, trading around $4,556.7 per ounce. Seeing gold climb back above $4,500 per ounce on Tuesday can be treated as a sign of feedback to Tehran’s suspension of communications with Washington in response to Israeli attacks in Lebanon.
From the macro factors’ perspective, the accelerated US inflation that is largely driven by the Middle East conflicts continues to price in a hike in US interest rates before the end of the year. The main focus now is going to Tuesday’s JOLTS job openings report. With a focus on the US monthly employment data that will be released on Friday. With these figures, investors can get further insight into the Fed’s policy outlook.
Gold Price Technical Outlook:
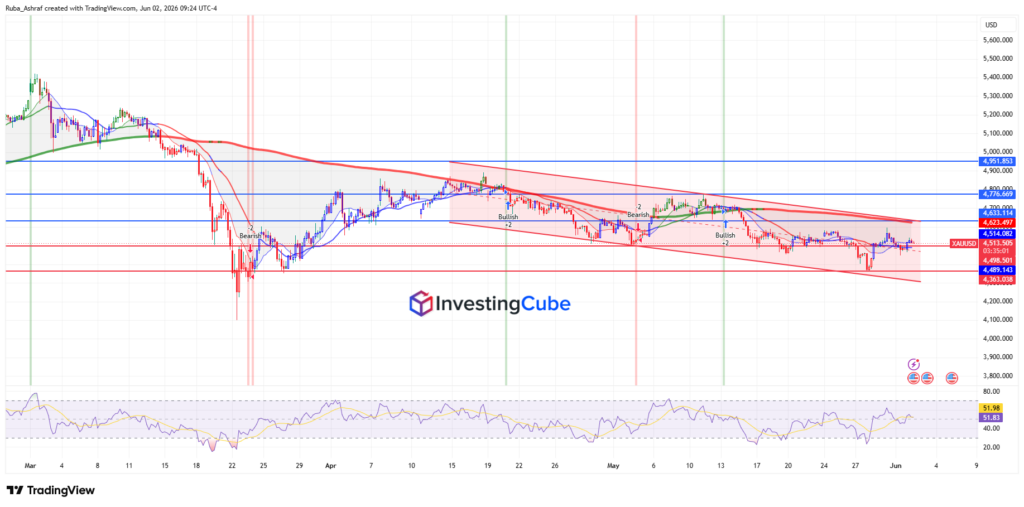
Looking at the 4-hour XAUUSD gold chart, the dominant feature is the large bearish descending channel. Price has been trading through these red parallel trendlines since the peak near the 4,800-4,900 area. The upper boundary of the channel acts as dynamic resistance while the lower boundary has repeatedly attracted buyers. Despite several bullish attempts to break above the descending channel, sellers still maintain broader control of the trend.
The most important resistance area is around 4,623-4,633, which aligns with the descending trendline and multiple prior reactions. Above that, resistance levels are visible around 4,776 and 4,952, representing previous swing highs and likely profit-taking zones if a breakout occurs.

On the downside, the chart highlights support near 4,514, followed by 4,498, 4,489, and the stronger support zone around 4,363. These levels define the current trading range and will likely determine the net directional move.
The moving averages tell us the story. The shorter-term averages are tightly clustered and mostly flat. This means that the market has lost momentum and entered a consolidation phase. The longer-term moving average is also flattening rather than rising aggressively. This usually occurs during a transition phase where neither bulls nor bears have a strong control advantage. However, the broader bias still slightly favors the downside until proven otherwise, because the price remains trading inside the descending channel.
Interest rates and gold have an inverse relationship because gold is a non-yielding asset; it doesn’t pay dividends or interest. An increase in interest rates by central banks (e.g. the US Federal Reserve) makes yield bearing assets such as government bonds more attractive, raising the opportunity cost of holding gold and putting downward pressure on the price of gold. When interest rates fall (or remain low), on the other hand, the opportunity cost falls and gold becomes a very competitive store of value
Gold is priced globally in U.S. dollars, creating a natural inverse relationship between gold and the dollar. When the U.S. dollar strengthens, gold becomes more expensive for buyers using other currencies. This often reduces global demand and puts downward pressure on gold prices. When the U.S. dollar weakens, gold becomes cheaper for international buyers. Lower prices can increase demand, leading to stronger buying activity and higher gold prices.