
The Sandbox price surged above $5.00 for the first time on Tuesday as investors flock to play-to-earn Metaverse projects. A rush of buying in Asian hours sent the Sandbox (SAND) value souring to $4.36 Billion. At the time of writing, the SAND token is trading at $4.7980 (+18.72%), making the project the 42nd-biggest cryptocurrency behind Tezos (XTZ).
Blockchain-based gaming projects like the Sandbox and Decentreland (MANA) have emerged as firm investor favourites over the last few weeks. Undoubtedly, Facebooks’ decision to rebrand to META and pivot to the Metaverse has strengthened the case for the asset class. As a result, the SAND token is up nearly 600% since the Facebook announcement on October 28th and +8,800% year-to-date.
To add some perspective, The Sandbox was worth $23 million on January 1st, $548m on March 29th, $747m on October 27th and over $4 billion today. The apparent dilemma for investors is whether The Sandbox price will continue to move higher in the long term or collapse in the short term? The answer could be both.
SAND Price Analysis
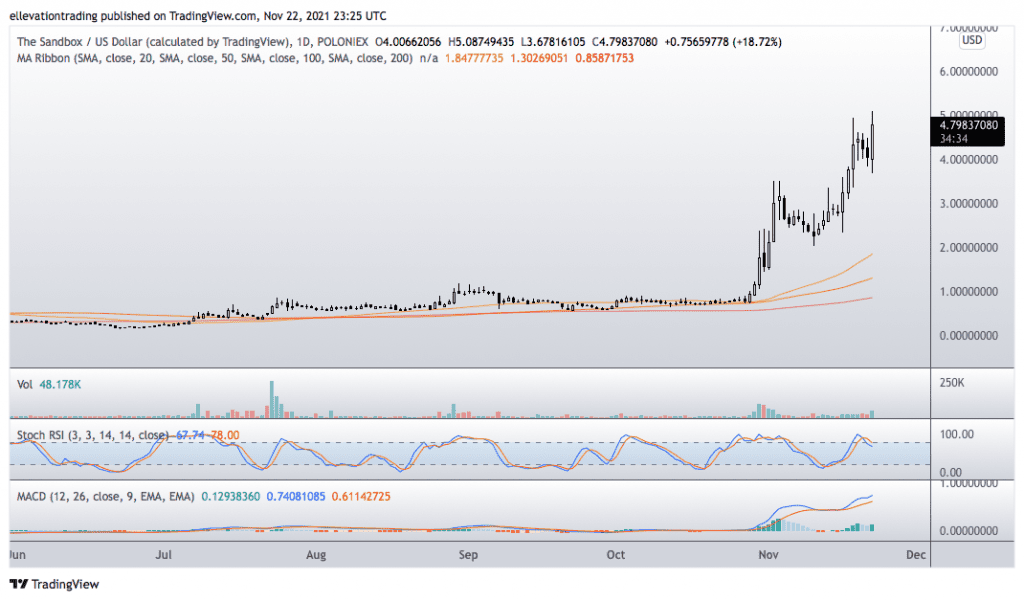
The daily chart shows the SAND token is experiencing extreme bullish momentum. However, the price action has resulted in the Relative Strength Index (RSI) and the Moving Average Convergence Divergence (MACD) indicators reaching excessive levels.
Despite that, the Sandbox price looks likely to continue the parabolic move in the immediate. However, at some stage, we could witness a violent correction. In my experience, extreme price action in either direction often leads to reversion to mean.
Therefore, although the price may continue higher in the near term, it will only increase the downside risk for late-stage buyers. On that basis, traders may wish to wait for an entry point that carries less risk.
The Sandbox Price Chart (Daily)
For more market insights, follow Elliott on Twitter.