Precious metals have started 2023 well. Gold, the blue-chip of the precious metals industry, has jumped to a multi-month high of $1,932, meaning it has soared by about 19.6% from its 2022 lows. It is now entering a bull market. Silver price, on the other hand, is already in a bull market, having jumped by 38% from its 2022 low. Platinum and palladium have both trailed.
What happened?
The XAG/USD exchange rate has done well as the US dollar index (DXY) has plunged from over $115 in 2023 to $102. Historically, silver has an inverse relationship with the US dollar since the two are mostly influenced by actions of the Federal Reserve.
This performance is mostly because investors don’t seem to trust what the Fed is selling. In multiple statements last week, Fed officials like Raphael Bostic and Lael Brainard argued that the Fed would stay the course on rate hikes. Staying the course means continuing to hike interests rates and holding them at a higher pace. But according to the WSJ, the Fed will consider hiking by 0.50% in its upcoming meeting and then pause in the following meetings.
Another reason why silver price has surged is the looming supply shortage. Analysts who follow the industry note that production was about 843.2 million ounces in 2022. That was lower than its all-time peak of 900 million in 2016. At the same time, demand remained at an elevated level as the global economy recovered. With China reopening, we could see more silver demand in 2023.
As such, analysts believe that silver price will likely rise to $30 in 2023. If this happens, it will be the highest level in almost a decade.
Silver daily chart analysis
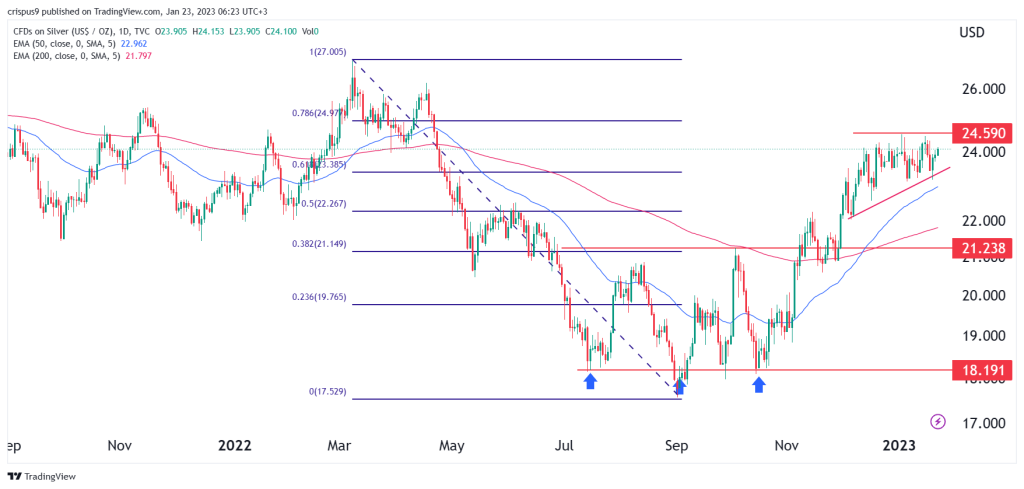
There are numerous bullish things that we see on the 1D chart, First, silver formed what looks like a triple-bottom pattern between July and November last year. Like a double-top, a triple bottom is one of the most bullish patterns in price action analysis. It managed to move above the neckline of this pattern at $21.23 on November 10th and then retested it a few days later. A break and retest pattern is also a bullish sign.
Silver has also rallied above the 50% and 61.8% Fibonacci Retracement levels. It also formed a golden cross, where the 200-day and 50-day exponential moving averages (EMA) make a bullish crossover. Most recently, it seems like it is forming an ascending triangle pattern. Therefore, from this long-term chart, the view is that the XAG/USD price will have a bullish breakout and retest the key level at $27, the highest point on March 2022.
On the flip side, a break below the 61.8% Fibonacci Retracement level at $23.41 will signal that there are still more sellers left in the marketplace.
XAG/USD 4H chart analysis
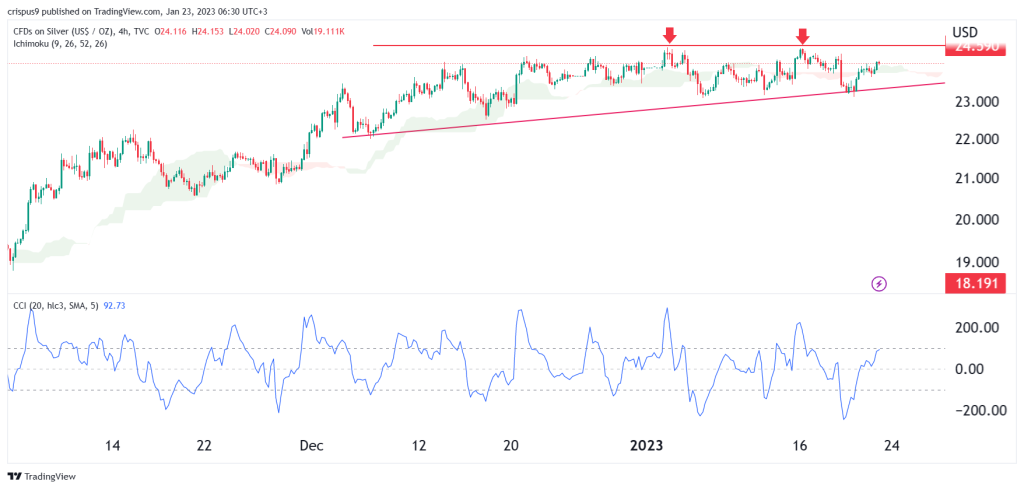
The ascending triangle pattern I mentioned above is seen well on the 4H chart. In it, silver has risen above the Ichimoku cloud while the Commodity Channel Index (CCI) is approaching the overbought level. Silver has found an important resistance at $24.60, the highest point on January 3 and January 16.
Therefore, a more defined bullish route will be defined if silver price can move above the resistance at $24.60. However, a drop below the ascending trendline at around $23.42 will signal that bulls have prevailed.
What is your silver outlook? Let us discuss this below.