The Shell share price is trading lower this Tuesday, and with growing headwinds coming from climate change activists, it may be a matter of time before a correction comes calling.
On Monday, the Shell share price closed at the second-highest level in 2022, touching a high of 2368.5. However, the resignation of a safety consultant and protesting environmentalists at the company’s annual general meeting could spur negative sentiment on the stock.
A safety consultant with the company has publicly resigned, accusing the oil giant of blatant disregard for climate change risks and “extreme harm” to the planet. The accusations were contained in an email sent to CEO Ben van Beurden and more than 1000 employees.
Caroline Dennett, the safety consultant in question, accused the company of having no plans to end its fossil fuel business, despite a net-zero target date of 2050. Dennett went further to say she could no longer work with a company that “dismisses risks of climate change and ecological collapse.”
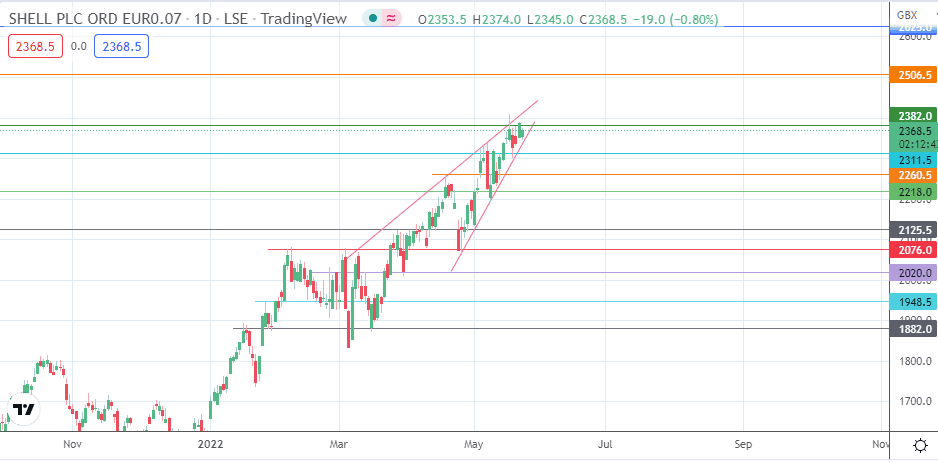
Technically speaking, the price picture on the daily chart shows a price action that is gradually winding to completion within the borders of a rising wedge pattern. Therefore, here is the latest Shell share price outlook.
Shell Share Price Forecast
Failure to breach the 2382.0 resistance could trigger a correction towards 2311.5 (19 May low). On the other hand, if this support is degraded, the resolution of the rising wedge will be complete. This scenario will see the bears target sequential support levels at 2260.5 (5 May 2022 low) and 2218.0 (4 May low). A breakdown of the latter opens the door to the 2125.5 support level (25 March high and 12 April low), where the measured move from the pattern ends.
On the flip side, a break of the 2382.0 is needed to stave off a correction and the completion of the rising wedge pattern. This breakout would open the door towards 2506.5 (5 February 2019 high). Additional targets to the north lie at 2625.0 (10 July 2019 high) and 2724.5 (4 October 2018 high).
Shell: Daily Chart