

- The Shell share price is trading lower this Thursday, and looks overdue for a correction as the rising wedge pattern evolves.
The Shell share price is down 2.73% as of writing, as Thursday has brought a shift towards risk aversion in the market. The decline in the Shell share price follows that of Brent crude oil, which has fallen 1.71% after the Organization of Petroleum Exporting Countries (OPEC) cut its 2022 demand forecast.
The oil cartel said that demand growth was expected to fall to 3.4 million barrels per day above the 2021 demand figure in its monthly market report. The reduction in its forecast represents a drop of 0.3million barrels per day from its previous 2022 demand outlook number. OPEC says that geopolitical developments in Eastern Europe and COVID-19 pandemic restrictions are to blame. The International Energy Agency (IEA) will provide its monthly market report later today.
In the meantime, Shell has sold its lubricant and retail business in Russia to Lukoil, following UK sanctions that prohibit UK businesses from doing business in Russia. The sale included 411 retail outlets and a lubricant blending facility in the Tver region.
Shell Share Price Outlook
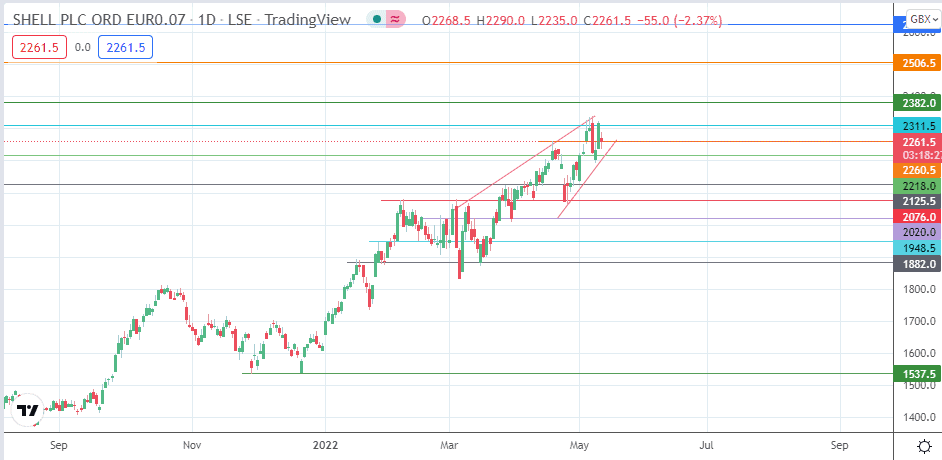
The evolving rising wedge pattern is the most significant finding on the daily chart. The price action candle presently sits on the 2260.5 support level, making it vulnerable after the intraday violation. The breakdown of the 2260.5 support and the wedge’s lower border completes the pattern.

A break of 2218.0 (21 April high in role reversal) strengthens the breakdown move, opening the door for a measured move that is expected to attain completion at 2020.0 (24 February high and 29 March low). This move must take out pivots at 2125.5 (25 March/5 April high) and 2076.0 (7/26 April lows).
On the flip side, if the bulls defend the 2260.5 support, this scenario could make way for a potential bounce that brings the 2311.5 barrier into focus. If the bulls uncap this resistance, 2382.0 (8 May 2019 low/16 August 2019 high) becomes the next target of choice. Additional barriers to this advance are located at the 2506.5 mark (13 February 2019/5 August 2019 highs) and the 2625.0 price resistance, where the 24 August 2018/21 June 2019 highs are found.
Shell: Daily Chart