


- Oil has roared back to life. Brent futures dipped as low as $95.12 on 30 September before climbing to a high of $112.45
Oil has roared back to life. Brent futures dipped as low as $95.12 on 30 September before climbing to a high of $112.45 on 23 October in an almost 18% rally, ending Friday at $111.70. With fears of supply and geopolitics keeping energy at the very fore of every market discussion we had checked in on that first leg.
when Brent rose above $100 on course for its biggest monthly gain since July. Pull up a chair, because the structure here is unusually clean and the stakes for CFD traders are high. Let’s read the chart together, candle by candle.
Twenty-One Sessions of Brent, Decoded
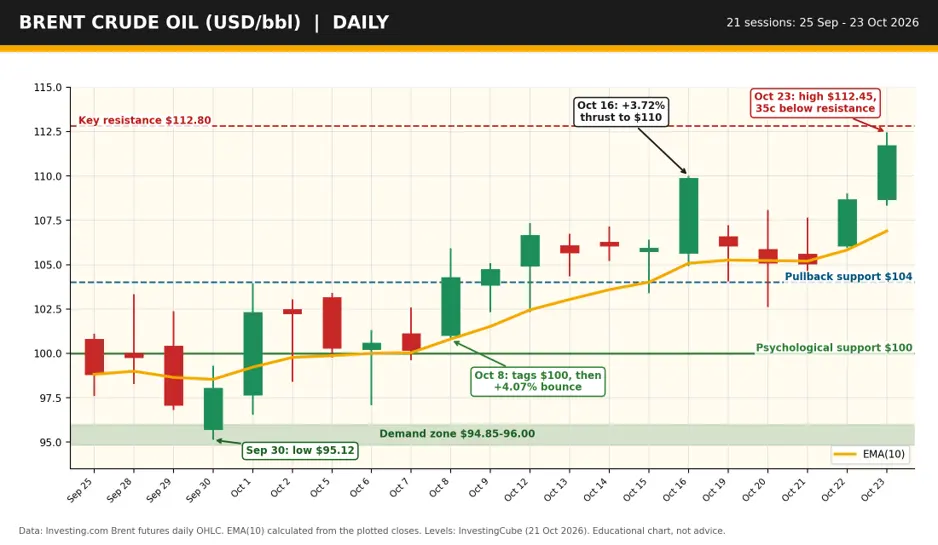
Start at the left. On 25 September, Brent dropped 7.3%, scraped its way to $95.12 on 30 September in the green demand zone—and up started the stairs. It hit $100.76 a week ago today, just above the $100 psychological floor then bounced 4.07%. You should not figure out how easy it is for price now, resting above the $104 line. The floor, meanwhile, continues to rise: $100.76 on Oct 8, $102.33 on the 12th and$108.33 on the 23rd.
A 3.72% thrust reached $110 on 16 October, and on 23 October Brent hit $112.45, just 35 cents under the $112.80 ceiling flagged in our Brent technical outlook.

The Amber Line and the Cup Pattern
You compute a 10-day exponential moving average of the plotted closes, which is what forms this amber line. Since 1 October, Price has closed above it every session except for a couple of minor intraday dips on 20 and 21 October — which shows that dip is being bought. At the time since mid-summer, analysts have also seen a rounding-bottom (cup) from $70.86 and the 50-day average above the 200-day Use the average to gauge trend, not as a trigger.
A rejection at resistance would likely drag price towards $104. One CFD warning: spot and futures differ, and the EIA spot series on FRED printed roughly $10 above futures on 20 October, so know which contract your broker tracks. Fed worries matter too, as $112 oil drove hawkish bets and hit silver.
Trading Oil CFDs Without Getting Burned
So, what’s the plan? However, to confirm a breakout, bulls need to see price close above the $112.80 mark on a daily basis which will open up $120 and then 125. In case of a rejection, a retreat to $104 appears likely with $100 as next target and the demand area from $94.85 to $96.00. Be careful with oil CFDs Spreads widen on headlines, rolling contracts may move your price and the use of leverage will increase both risks and rewards. Trade smaller than what feels exciting, keep stops beyond the level that proves you wrong, never adding to losers.
Oil ripples through economies, as when oil and FII selling weighed on India’s Sensex and Nifty. Plan the trade before you place it: entry, stop, target and size, written down. Educational only, not advice, so please do your own research.