



- Earnings Jump: Oracle shares spiked 10.73% after investor updates eased AI spending concerns.
- Moving Averages: The stock reclaimed its 50-day averages (~139–142), while 200-day lines remain overhead resistance.
- Financials: Long-term revenue targets and expected positive free cash flow by 2028 help balance heavy debt notes
Oracle was the AI “darling” and then became a “debt concern,” and now as of October 28th, it’s once again a “headline hero.” On October 28th, Oracle’s stock rose by 10.73 percent after its investor day, even though the company had lost nearly 33 percent of its value in the first ten months of 2021 prior to the jump. Is this a real comeback or a short-squeeze? The charts’ moving averages provide some answers.
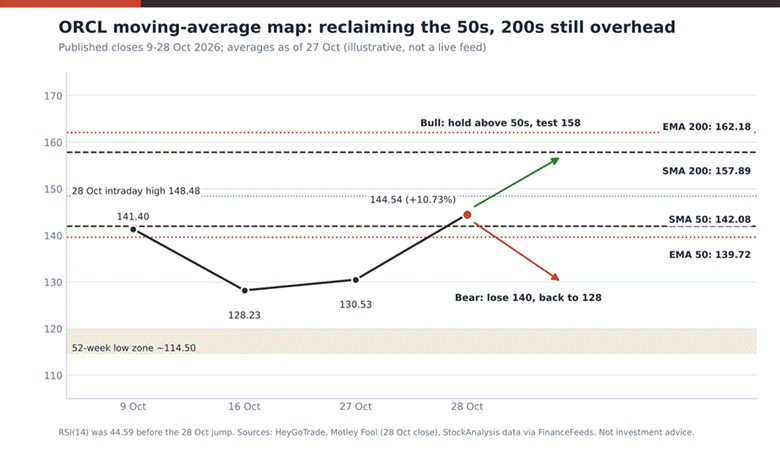
Figure 1: Oracle (ORCL) moving-average map in Oracle red and charcoal, built from published closes and averages (illustrative).
Reading the Chart
Trace the charcoal line. ORCL closed at 141.40 on 9 October, fell to 128.23 on 16 October, edged up to 130.53 on 27 October, then leapt to 144.54, the red dot, with a day range of 128.38 to 148.48, according to Motley Fool’s market report. On 27 October readings, dashed charcoal lines show the 50-day SMA at 142.08 and the 200-day SMA at 157.89, while dotted red lines show the 50-day EMA at 139.72 and the 200-day EMA at 162.18. Oracle just reclaimed both 50s, but both 200s sit overhead. The sand band marks the 52-week low near 114.50.
Why It Matters
Oracle’s long-term goal of hitting at least $225 billion in revenue for the fiscal year ending June 30, 2030 remains intact. Oracle also plans to reach positive free cash flow during the second half of the fiscal year ending June 30, 2028, and to generate approximately $30 billion in free cash flow during the fiscal year ending June 30, 2029, according to The Next Web. Bloomberg Intelligence Analyst Anurag Rana said that this “could alleviate concerns over increased capital expenditures beyond the next two years.” However, there are some important facts to consider: free cash flow was negative $23.7 billion during the previous fiscal year; and S&P has assigned Oracle’s debt a rating just one level above “junk.” Ultimately, the primary concern for investors will be if Oracle’s projections can be realized as actual cash flow.
AI sentiment is the tide. Our AI growth stock selloff warning showed how high yields punish expensive capital plans.
Nvidia’s Meta investment shows how fast mood flips.
Compare Microsoft’s earnings-week chart for a peer view, because AI spending cycles move together.
Bull, Bear and Neutral Paths
Momentum was neutral prior to the spike. RSI was at 44.59% and thus, the price increase was due to news and not because of a stretched market condition.

- Bullish: holding above 142 keeps 148.48 in play, then a test of 157.89.
- Bearish: losing 139.72 reopens the 128 area and the 114.50 low.
- Neutral: consolidation between 139 and 148 as buyers digest the news.
The 200-day moving averages (which currently sit at about 158 and 162) will be the most accurate test of whether or not this is a trend change. The fact that analysts have differing opinions on this stock (Stifel has a $200 buy rating while Rothschild Redburn has a $110 sell rating) is an indicator of how much uncertainty there still exists in the market regarding this stock.
Quick FAQ
Why did Oracle stock jump on 28 October?
The company lowered its investor day target for revenue and free cash flow which has alleviated some of the concern over the large amount of money being invested in AI. However, there are still some concerns regarding how the company will finance the investment.
Is Oracle above its 200-day average?
No. On October 27th readings of the 200-day simple moving average (SMA) was 157.89 and the exponential moving average (EMA) was 162.18, both above the 144.54 close.
Where is Oracle support?
Watch 142 and 139.72 first, then 128 and the 114.50 low.
I need to decide what level I am going to buy at, determine how much I am willing to lose on this trade, and then go look again after Oracle reports its earnings. Share your buying levels with other traders by leaving a comment below. I’m providing you with an educational perspective; I am not giving you advice.