


- Ruble Gains: The Russian ruble rose about 3.8% over the past month despite a 14% key rate.
- Main Drivers: Strong oil prices (Brent near $105) and high interest rates back the currency.
- Projections: Spot trades around 80.53, with Q4 forecasts pointing to 80.13 and 77.05 long-term.
The Russian rouble is one of the most misunderstood currencies. It operates with capital controls, sanctions, and a 14% key rate; however, it has gained approximately 3.8% in value over the last month. Has the dollar begun to lose its control over USD/RUB, or is this simply a temporary slowdown? Spoiler: this story is more about rates and oil than headlines. Let’s look at the chart.
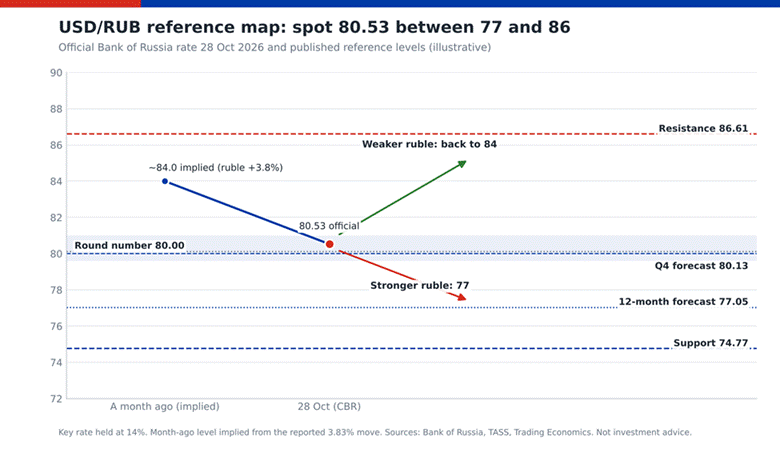
Figure 1: USD/RUB reference map in the rouble’s blue and red, built from the official rate and published levels (illustrative).
Reading the Chart
Start on the left. Backing out the reported 3.83% move implies USD/RUB near 84.0 a month ago, the blue dot. It has since slid to 80.53, the Bank of Russia’s official rate for 28 October, as TASS reported. The Spot price of crude oil is now in the area defined by a light blue band between 79.6 and 81.0 that includes the round number 80.00 and the year-end forecast of 80.13. Above, the main resistance identified in previous InvestingCube analyses remains at 86.61. Below, the dotted line at 77.05 represents the 12-month forecast while 74.77 represents the next level of support. It is in this narrow band that the chart becomes interesting as a result of the grouping of forecasts and round number psychology.
Why It Matters
The Bank of Russia maintained its key interest rate at 14% during October, and Trading Economics projects USD/RUB around 80.13 before the end of the fourth quarter and 77.05 within one year; the central bank has indicated that they expect the average key interest rate to be between 12.5% and 13.5% through 2027. High interest rates generally help strengthen the rouble. To investors, this demonstrates that policy credibility is just as important as price trends.
Oil is the other pillar. The EIA’s October outlook sees Brent averaging about $105 in the fourth quarter, and our Brent line in the sand analysis shows crude pressing 112.80.
Oil importers feel the opposite pain, as the rupee under renewed pressure shows.
Managed lira depreciation reminds us how central banks shape emerging-market charts. Short term, headlines can overwhelm charts; long term, oil and rates set the tone.
Bull, Bear and Neutral Paths
- Bullish US Dollar, Weak Russian Ruble: A Rebound Above 81.0 Will Target 84.0, Followed By 86.61.
- The U.S. dollar is falling against the Russian rouble; if it drops below 80.00, it could fall to 77.05 and eventually to 74.77.
- Neutral: Maintain a range of 80.00 to 81.00 with the 14% key rate as an anchor for flow.
Official and offshore rates may vary, so always confirm the Bank of Russia’s official rates prior to placing a trade. Technical levels in this market should be treated as less significant than those in highly-liquid markets like USD/ZAR, as the low volume of trading and potential for sudden price movements due to sanctions news can create gaps in prices. Additionally, never risk more money than you are willing to lose.

Quick FAQ
Is the rouble getting stronger?
Over the past month, yes, by about 3.8% according to Trading Economics.
What is the official USD/RUB rate?
The Bank of Russia set 80.5307 for 28 October.
Where could USD/RUB go next?
The forecasts show a value of approximately $80.13 at the end of this quarter, and $77.05 for the year. However, if there are sudden shifts in the market, these values could shift rapidly. Therefore, the user should consider them to be general trends.
Will the Ruble continue to advance, or will it find a bottom at 80.00?
Look at the price of oil, the central bank’s key interest rate, and that psychological level. Give us your thoughts on what you think may happen next and check back on this chart after the central bank has met. Please remember this is for educational purposes only.