
The Nasdaq 100 index continues its march into record highs, as it responds positively to the upbeat US ISM Manufacturing PMI number. According to data released a short while ago, the index that measures business conditions in the US manufacturing sector rose from 54.2 in July to 56.0 in August 2020. Construction spending also improved from -0.7% last month to a modest 0.1% this month, even though this did not meet market expectations (1.0%). The shortfall in expectations over construction spending appeared to have dampened the positive ISM Manufacturing PMI number.
The upbeat PMI figures indicate a fourth consecutive month of recovery after a collapse that bottomed in May. According to the report, fifteen out of eighteen reported industries in the manufacturing sector reported growth. While the airline industry continues to witness great pressure, but the Chemical Products sector reports good business activity, with production unable to match demand at the moment.
Also boosting sentiment on the Nasdaq 100 are performances by Apple and Tesla stocks following the stock split that took effect yesterday. Tesla stormed to a 12.5% gain on Monday, and even though it opened lower today, buyers are starting to drive that stock off its daily lows as well. Apple is already 2.25% up on the day as it looks to consolidate its 3.39% gain on Monday.
There are also emerging reports that the US Trade Representative’s Office has extended tariff exclusions on some Chinese goods till the end of the year. This is also a Nasdaq-positive development, as several listed companies are directly exposed to the situation.
Technical Outlook for Nasdaq 100
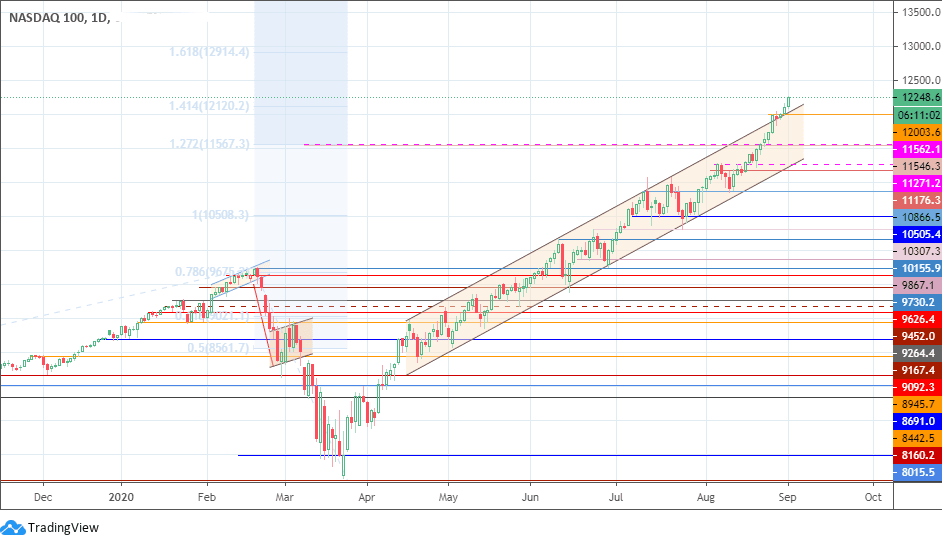
The Nasdaq 100 has conclusively burst out of the ascending channel, and the pullback-bounce move of Thursday and Friday last week confirmed this move. Price now challenges the speculative resistance at 12120.2 (141.4% Fibonacci extension from the swing move that started at the 2019 lows to the Feb 2020 top). A break above this level allows the Nasdaq 100 to pursue the 12914.4 potential resistance at the 161.8% Fibonacci extension.
The flip move could occur if the sentiment dips, with the channel’s return line serving as the initial support around the 12003.6 price area (26 August high). A further decline brings in 11562.1 as potential additional support. 11271.2 and 11176.3 are attainable if the price runs through the lower channel border.
Don’t miss a beat! Follow us on Telegram and Twitter.
Nasdaq 100 Daily Chart
More content
- Download our latest quarterly market outlook for our longer-term trade ideas.
- Follow Eno on Twitter.
- Do you enjoy reading our updates? Become a member today and access all restricted content. It is free to join.