

- The FTSE 100 index has staged a strong comeback in the past few weeks as investors cheer the new Rishi Sunak administration.
The FTSE 100 index started the year well. It soared to a high of £7,859, which was the highest level since 2019. The index has outperformed its global peers like Nasdaq 100, German DAX, and Shanghai index. It has managed to cross the important resistance level at £7,682. The index has soared by about 61% from the lowest level in 2020. So, what next for the FTSE 100 index in 2023, 2025, and 2030?
Please note that this article was originally written in November 2022. We upgrade it regularly with new information.
What is FTSE 100?
The FTSE 100 is an index that tracks the performance of the biggest British companies by market cap. It aims to act as a gauge for the performance of UK stocks. The FTSE is operated by FTSE Russell, a company that provides indexes, data, research, and analytics. Other indexes run by the company are the Russell 2,000, China A50, FTSE 250, and FTSE All Share indices.
FTSE 100 constituent companies
The FTSE 100 index is made up of companies in all industries like consumer staples and discretionary, energy, retail, finance, mining, telecommunication, technology, real estate, and healthcare, among others. Shell, the biggest constituent company, has annual revenue of over £365 billion. The smallest company in the FTSE 100 index is Rightmove, which has annual revenue of over £155 million.
The biggest FTSE constituent company in the FTSE 100 by market cap is Shell, which is valued at over £170 billion. It is followed by companies like Unilever, HSBC, BP, Diageo, and British American Tobacco.
The biggest energy FTSE 100 constituencies are Shell and BP. On the other hand, the biggest retail stocks in the index are Tesco, Sainsbury, and Ashtead Group. Meanwhile, the biggest banks in the FTSE 100 index are HSBC, Lloyds Bank, Barclays, and NatWest. Mining stocks in the index are Rio Tinto, Glencore, Anglo-American, and Antofagasta.
FTSE 100 vs FTSE 250 vs FTSE 350
A common question is on the difference between the FTSE 100, FTSE 250, and FTSE 350 indices. The FTSE 100 index tracks the biggest companies in the UK. On the other hand, the FTSE 250 index is made up of the 250 companies that follow those in the latter index.
The two indices have a close relationship in that it is easy for a company to move from FTSE 250 to FTSE 100. Companies that are relegated from the FTSE 100 move back to FTSE 250.
The FTSE 350 index, on the other hand, is made up of a combination of the FTSE 100 and FTSE 250 indices.
FTSE 100 risers in 2023
Most FTSE 100 index constituents have done well in the past few days. A closer look shows that less than 10 companies in the index have declined this year. Ocado share price has jumped by more than 16% as investors predict that the company will do well this year. They are also buying the dip as the company’s stock plunged in 2022.
Carnival share price soared by over 14.8% as cruising continued. Other travel stocks like EasyJet and IAG have done well. Standard Chartered share price has risen by more than 12% as hopes that the bank will be acquired soon rose. Other top companies that have done well in the index are BT Group, Associated British Foods, Next PLC, Rolls-Royce, and HSBC have also outperformed the index.

On the other hand, companies like Glencore, Centrica, SSE, Rentokil, Compass, GSK, and Croda International shares have been the only laggards.
FTSE 100 latest news
There are several factors moving the FTSE index. First, First, investors are focusing on the rising possibility that the UK would sink to a deep recession as interest rates surge. There have been concerns about the economy, with some analysts warning that it will underperform even Russia. The ongoing strikes in critical sectors have not helped the situation.
Second, the index is reacting to the falling home prices. Data published by the Nationwide Society showed that the house price index declined by 1.5% in December. It fell by 2% on a year-on-year basis. Halifax data showed the same thing. As a result, companies like Taylor Wimpey and Barratt Development have seen their share prices retreat.
Third, some companies have come under pressure. Glencore is being haunted by its coal business. In January, the company received a letter from leading shareholders asking the management about its commitment to reducing its carbon emissions.
FTSE 100 live chart
FTSE 100 forecast 2023
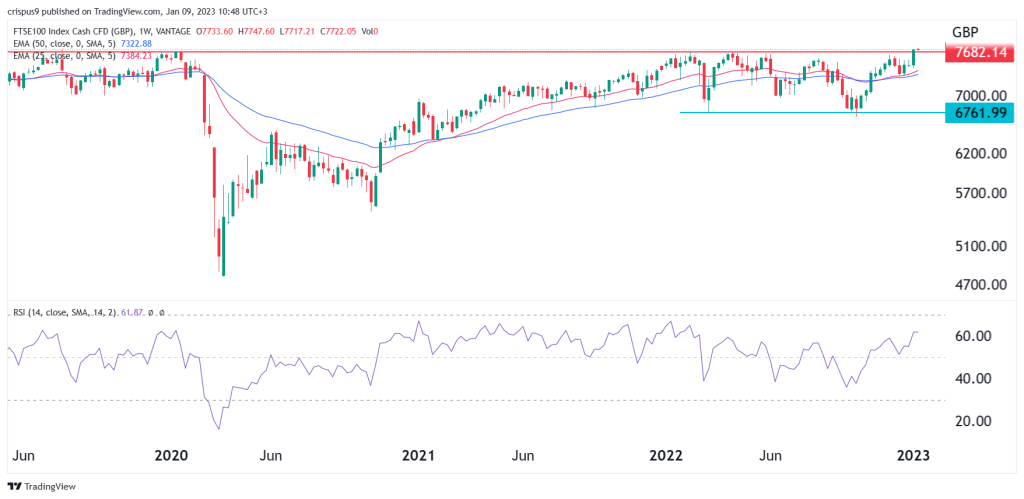
The weekly chart shows that the FTSE 100 index has largely been in a consolidation phase in the past few weeks. It has remained between the important resistance point at £7,682 and £6,761. It managed to move above the important resistance level at £7,681. The index has formed an inverted head and shoulders pattern and moved above the 25-week and 50-week moving averages. Oscillators like the Relative Strength Index (RSI) has moved above the neutral point.
Therefore, the FTSE index will likely continue rising as buyers target the key resistance point at £7,300 in 2023. A drop below the support at £6,760 will invalidate the bullish view.
FTSE 100 forecast 2025
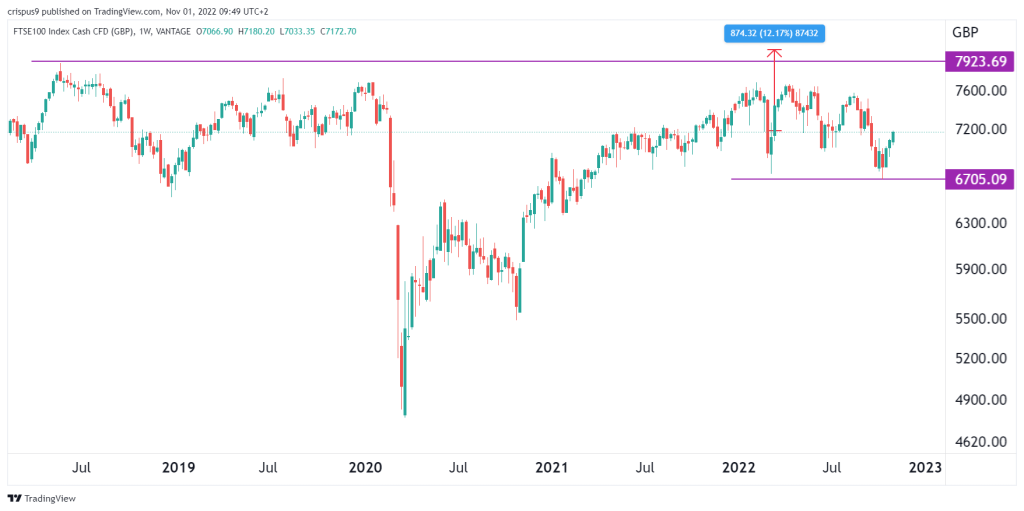
The FTSE 100 index will likely go through a turbulent phase by 2025. Some of the challenges the FTSE 100 shares will face include geopolitics, Brexit, and possibly political uncertainty. Turning to the weekly chart, we see that it has been moving sideways in the past few months.
In all, it has been in a bullish trend since 2020. Therefore, there is a likelihood that the index will have a positive performance by 2025. If this happens, the next key level to watch by 2025 will be at 8,000. This price is about 12% above the current level.
FTSE 100 forecast 2030
It is relatively difficult to predict where the FTSE 100 index will be in 2030. Besides, many things, such as another global pandemic could happen by then. Still, in my view, I believe that the FTSE index will be much higher in 2030 than where it is today. Historically, the index has tracked the performance of American stocks, which have done well in extended periods. Therefore, I suspect that the index will rise to about £9,000 by 2030.
FTSE 100 historical data
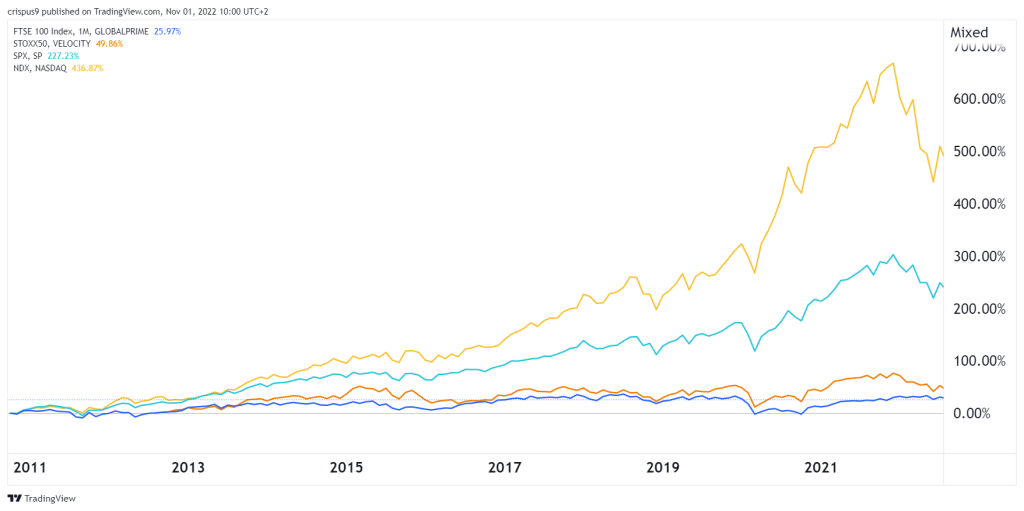
The FTSE 100 index has risen by more than 25% from its lowest level in 2010. In this period, it has underperformed the Stoxx 50 index, which has risen by more than 50%. This performance is mostly because the index lagged amid high concerns about Brexit. The FTSE 100 index has underperformed the S&P 500 and Nasdaq 100 indices that have rallied by more than 200%.
How to invest in the FTSE 100
There are two main ways of investing in the FTSE 100 index. First, you can buy CFDs tied to the index. A CFD is a financial instrument that tracks the price of an asset. These products are offered by forex and CFD brokers. Another way is to invest in FTSE 100 ETFs. Some of the top ETFs are the iShares Core FTSE 100 indices, Lyxor FTSE 100 ETF, and HSBC FTSE 100 ETF.
