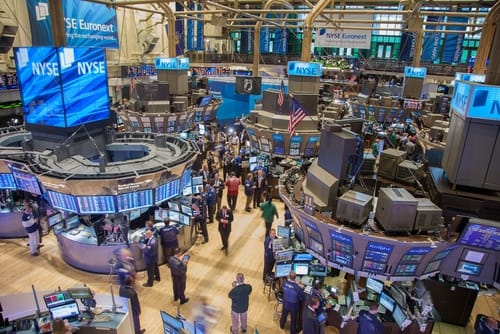
The Dow Jones index wavered today as investors waited for the Federal Reserve interest rate decision. This is after the index dropped 300 points yesterday. But a closer look at several indicators show that the Dow and the overall stock market is due for a pullback as euphoria and greed returns.
Greed has returned
As I wrote yesterday, CNN Money’s Fear and Greed index has been on an upward trend after bottoming in March as the crisis escalated. As of this writing, the index is at 66, which is in the greed zone.
Want evidence that investors are getting greedy? According to Bloomberg, many investors are now buying shares of bankrupt companies like Hertz Global. Indeed, the company’s share price has surged by more than 383% in the past five days alone. Even though it has declared bankruptcy, the company is now valued at more than $594 million.
Another company approaching bankruptcy that has seen a lot of action is Chesapeake Energy, the fallen shale giant. The shares have rose by more than 50% in the past week. Finally, shares of a car company called Nikola have risen by more than 300%, making it more valuable than Ford Motors.
All this is evidence that the fear and greed index is right. Also, Citigroup’s panic/euphoria index has been in euphoria for a while now. This means that the Dow Jones could be headed lower in the near term.
Dow Jones is overbought
Forget the fear and greed index and panic/vs euphoria for a while and look at the chart. As you can see, the most common technical indicators like the Relative Strength Index (RSI), moving average convergence and divergence (MACD), Smart Money Index (SMI) and stochastic all show that the Dow Jones is in the overbought territory.
Does this mean that the Dow Jones is headed back to March lows? No. It simply means that the index could have a significant pullback in the near term. Since the Dow Jones goes up always in the long term, the pullback will be a welcome buying opportunity for long-term investors. The chart below shows the Dow Jones index with the Stochastic, SMI, and MACD.
Download our Q2 Market Global Market Outlook
Dow Jones technical outlook
On the daily chart below, the Dow has been on an upward trend and is currently above the 78.6% Fibonacci retracement level. It is also above the 50-day and 100-day exponential moving averages. While the upward trend may continue in the near term, there is a likelihood that a pullback may happen as bears attempt to move below $27,000.
Don’t miss a beat! Follow us on Telegram and Twitter.
More content
- Download our latest quarterly market outlook for our longer-term trade ideas.
- Follow Crispus on Twitter.
- Do you enjoy reading our updates? Become a member today and access all restricted content. It is free to join.

