The Dow Jones index has rallied by almost 20% this year. By so doing, the index has lagged other popular global indices like the S&P 500, CAC 40, and the German DAX index. It has also lagged the tech-heavy Nasdaq 100 index. Let us look at the best and worst-performing shares in the index as we move to the Santa Claus season.
DJIA performance
The Dow Jones index has lagged the broad market this year. This performance is mostly because the index is mostly weighted tech while industries that did well like finance and energy are less represented. Still, the Dow Jones performance is relatively strong considering that it has jumped to an all-time high. It has also risen in the past several consecutive years, helped by low-interest rates.
Most companies in the Dow Jones have rallied this year. Indeed, only six of the Dow 30 constituents have dropped year-to-date.
The best performing stock in the Dow this week has been Microsoft. The stock has jumped by more than 52% year-to-date as the demand for cloud computing products has remained at a record high. It is followed by Home Depot, which has now become the biggest retailer in the United States. It has a market value of more than $416 billion. It has passed Walmart, which is valued at more than $385 billion.
The third best performer in the Dow Jones is American Express, whose stock has risen by 48%. The next best performers are Goldman Sachs, Salesforce, Chevron, JP Morgan, and UnitedHealth.
On the other hand, the only laggards in the DJIA are Walt Disney whose share price has dropped by more than 13.15%. Investors are concerned about the company’s Hong Kong theme park closure and the slow growth of its Disney+ product. Other worst performers are Verizon, Amgen, Visa, and IBM.
Dow Jones forecast
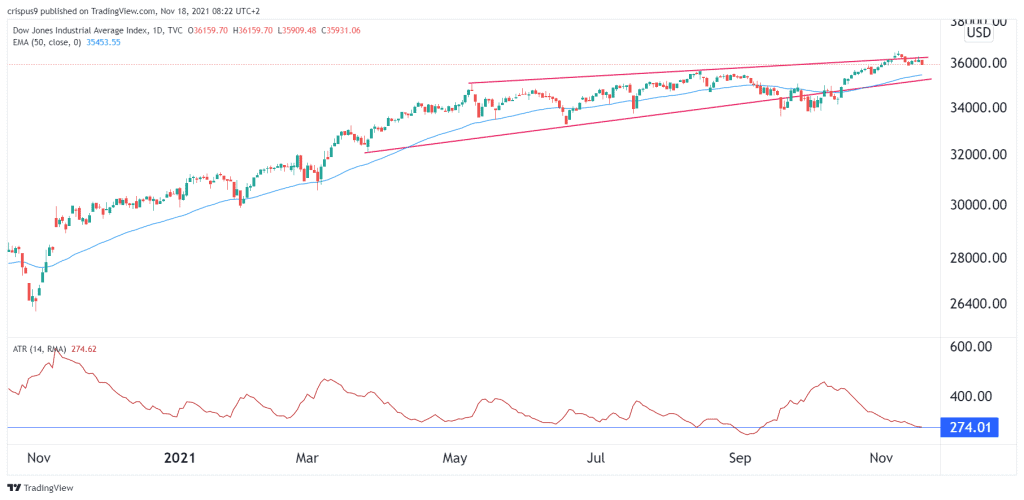
The daily chart shows that the Dow Jones index has been in a tight range in the past few weeks. The index has formed a rising wedge pattern, which is usually a bearish sign. At the same time, it is slightly above the 25-day and 50-day moving averages while the Average True Range (ATR) has declined to the lowest level since September 13th.
Therefore, while the overall trend is bullish, a major pullback in the coming weeks cannot be ruled out. This means that the index could retest the key support at $34,000.