Archived Article This article was published more than 5 months ago. The market data, prices, forecasts, and analysis were accurate at the time of publication but may have changed since then. Please use this article for historical reference only and refer to our latest content for current market information.
- Glencore Share Price Forecast: LON: GLEN has formed a symmetrical wedge pattern form which a breakout seems imminent.
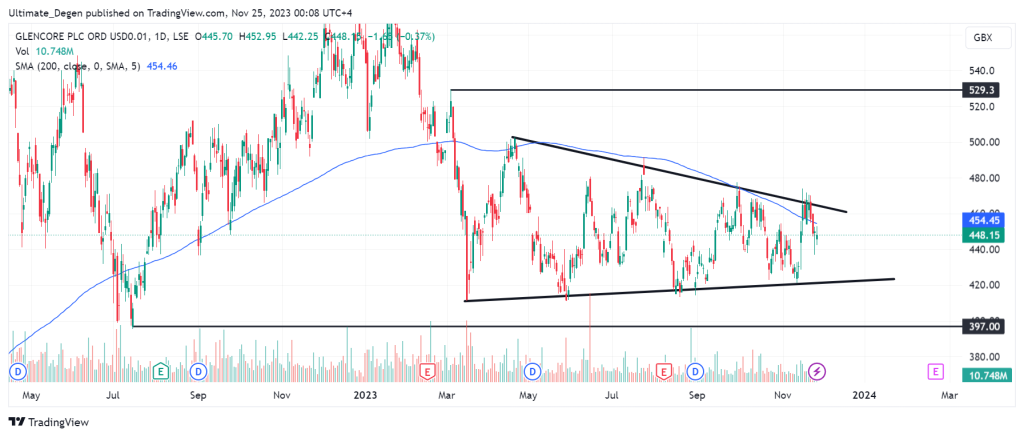
Glencore (LON: GLEN) share price is stuck within a trading pattern that is about to approach its apex. This has resulted in a choppy, sideways price action, which may end very soon. However, history tells us that such patterns usually precede massive breakouts.
Due to the prolonged sideways price action, a lot of liquidity has developed above and below the current price level. This suggests that there could be a fakeout before the real breakout occurs.

Considering the recent failure to break above the 200 MA on the daily chart, the outlook appears to be bearish. However, the short timeframe indicators are pointing toward another attempt to reclaim the key moving average.
On Friday, the British benchmark FTSE 100 index showed minor gains and close with a modest 0.06%. The overall market sentiment remained mixed and Glen shares closed 0.37% above their previous close.
There is a clear formation of the symmetrical wedge pattern on the daily chart of Glencore share price. In case of an upward breakout, the bullish target of 529p would be on the cards. However, if the price breaks down toward the downside, a retest of 397p would be the most likely scenario.