



Archived Article This article was published more than 5 months ago. The market data, prices, forecasts, and analysis were accurate at the time of publication but may have changed since then. Please use this article for historical reference only and refer to our latest content for current market information.
- The GALA price has reversed over 35% from the recent all-time high of $0.8427 as the Metaverse rally runs out of steam.
The GALA price has reversed over 35% from the recent all-time high of $0.8427 as the Metaverse rally runs out of steam.
In November, Gala (GALA) was one of the best performing cryptocurrencies as investors flocked to Metaverse-related digital assets. Like Decentraland and The Sandbox, GALA saw a buying rush after Facebook rebranded to Meta. Within a month of the announcement, the GALA token had risen a dizzying 800% to a $5.7 billion valuation. But since then, Gala’s price action has been primarily bearish, suggesting buyers are unloading tokens to lock in profits. As a result, the price has sliced through several support levels, which may encourage more selling.

Price Analysis
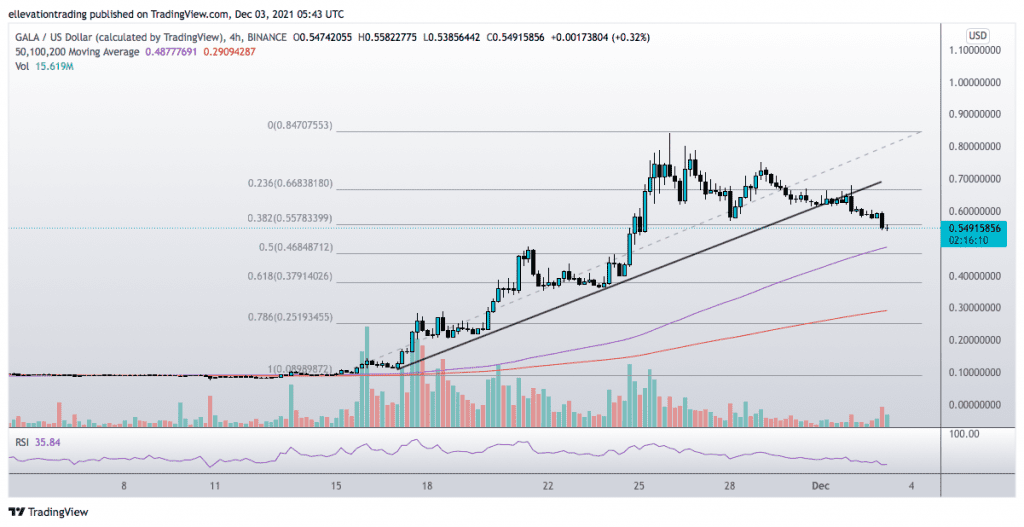
The 4-hour price chart shows GALA has broken down from its uptrend and is now below the support of the November 28th low at $0.5700. Subsequently, the price is on track to test the 100-Day Moving Average (DMA) at $0.4877.
Notably, the 100 DMA lines up almost perfectly with the November 21st high of $0.4890 and the 50% Fibonacci retracement level of $0.4685, meaning buyers are likely to emerge if the price drops below $0.5000. In contrast, if GALA breaks below the 100 DMA, the price could extend lower towards the 61.8% Fibo retracement level of $0.3791.
Until GALA reclaims the former trend support (now resistance ) at $0.6900, I expect it to trade with a bearish bias. Therefore successful clearance of the trend invalidates the bearish view.
Gala Price Chart (4-hour)
For more market insights, follow Elliott on Twitter.