

- Discover how geopolitical uncertainty and rising inflation are affecting XAUUSD. Get insights and updates on technical levels to watch.
For the third consecutive week, the XAUUSD opened in the same cautious sentiment. The gold price is hovering in a tight range below the key resistance of $4,800. It’s currently trading around $4,704 per ounce. Investors are cautious due to mixed signals around them. On the side, there is mild optimism about the end of the US-Iran war. On the other side, the Strait of Hormuz remains closed, weighing on energy supply and oil prices.
Hence, inflationary pressures are strengthening due to high crude oil prices. Therefore, market participants are now focusing on the Federal Reserve’s monetary policy. It’s widely expected that the Fed will leave interest rates unchanged. This indicated a steady monetary policy in the near term. However, attention is also shifting toward potential leadership changes, with Jeron Powell possibly stepping aside for former Governor Kevin Warsh, whose policy approach is generally viewed as more dovish.
XAUUSD Technical Analysis | Key Levels to Watch:
We still stand at almost the same point as last week, with XAUUSD continuing to consolidate within a tight range just above the 4,700 level. This reflects that the gold lacks clear directional conviction. Despite various global headlines, including the recent US-Iran peace proposal, the market is in a “wait-and-see” mode ahead of this week’s major central bank meetings.
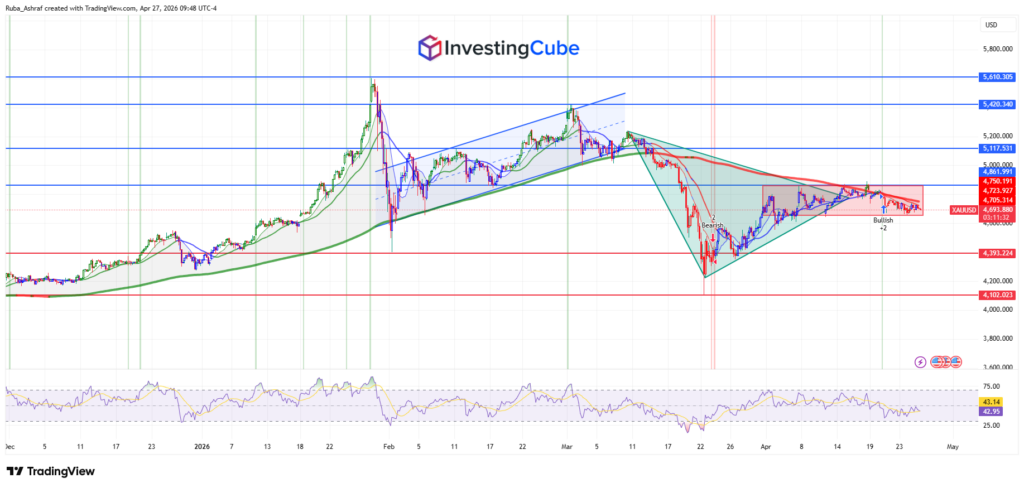
Looking at the 4-hour chart, price action remains within the red rectangle zone, which highlights a clear range-bound environment. This indicates a period of indecision where the highs are getting lower, and the lows are getting higher. Typically, a breakout from such a pattern leads to a sharp, sustained move. The upper boundary around 4,750-4,720 continues to act as strong resistance. While the lower boundary near 4,700-4,650 is providing short-term support.

The price is oscillating right around the 200-period moving average (thick green line). The fact that the price is “hugging” this line and not trending above or below it verifies that the medium-term trend is neutral at this moment. The RSI is hovering in the mid-range, showing neutral to slightly bearish momentum, with no clear divergence to signal an immediate reversal.
Potential Scenarios:
- Bearish scenario: A breakdown below the 4,700 support zone could trigger a move toward 4,393, with further downside extending toward 4,102 if selling pressure accelerates.
- Bullish Scenario: A sustained breakout above 4,750, moving beyond the descending trendline, would pave the way for a move toward 4,861 and potentially higher resistance levels. Such a move would invalidate the bearish structure.
Today, the trend is neutral, but breaking out of this triangle is likely to define where Gold goes for the rest of May. Watch that $4,750 resistance box; it is the main obstacle for the bulls right now.
When the real interest rates are high, investors prefer to hold bonds to benefit from the yields. In the current 2026 context, with the Fed currently maintaining rates around 3.50%-3.75%, gold faces downward pressure because the opportunity cost of holding it is higher. If the Fed hints at a rate cut, gold typically rallies as bonds become less attractive and capital will move toward the yellow metal.