
Bitcoin price (BTCUSD) is down by 0.83% today as traders continue to reflect on last week’s plunge. The price is trading at $10,288, which is significantly lower than August’s high of $12,489. It has dropped by 12% in the past seven days while Ripple and Ethereum price have dropped by 22% and 15%, respectively.
Why Bitcoin price dropped last week
There are three main reasons why BTC dropped sharply last week. First, it dropped because of the overall mood in the market as investors sold-off top assets. Indeed, the stock market in the United States had its worst week since May. Also, silver and gold prices dropped sharply.
This drop was partially because of institutional investors who were liquidating their holdings after the summer holidays. It was also because of the strong economic data from the US that meant that the Fed would tighten faster than expected.
Second, Bitcoin price dropped last week because of the overall stronger US dollar. Indeed, the US dollar has jumped by almost 1 percent in the past five days. And last week, it had its best week in several months as traders reacted to strong manufacturing, services, and employment numbers from the United States.
Third, BTCUSD dropped because of profit-taking. That is because its price had previously rallied by more than 100% in the past few months.
So, what is the best way to trade Bitcoin now?
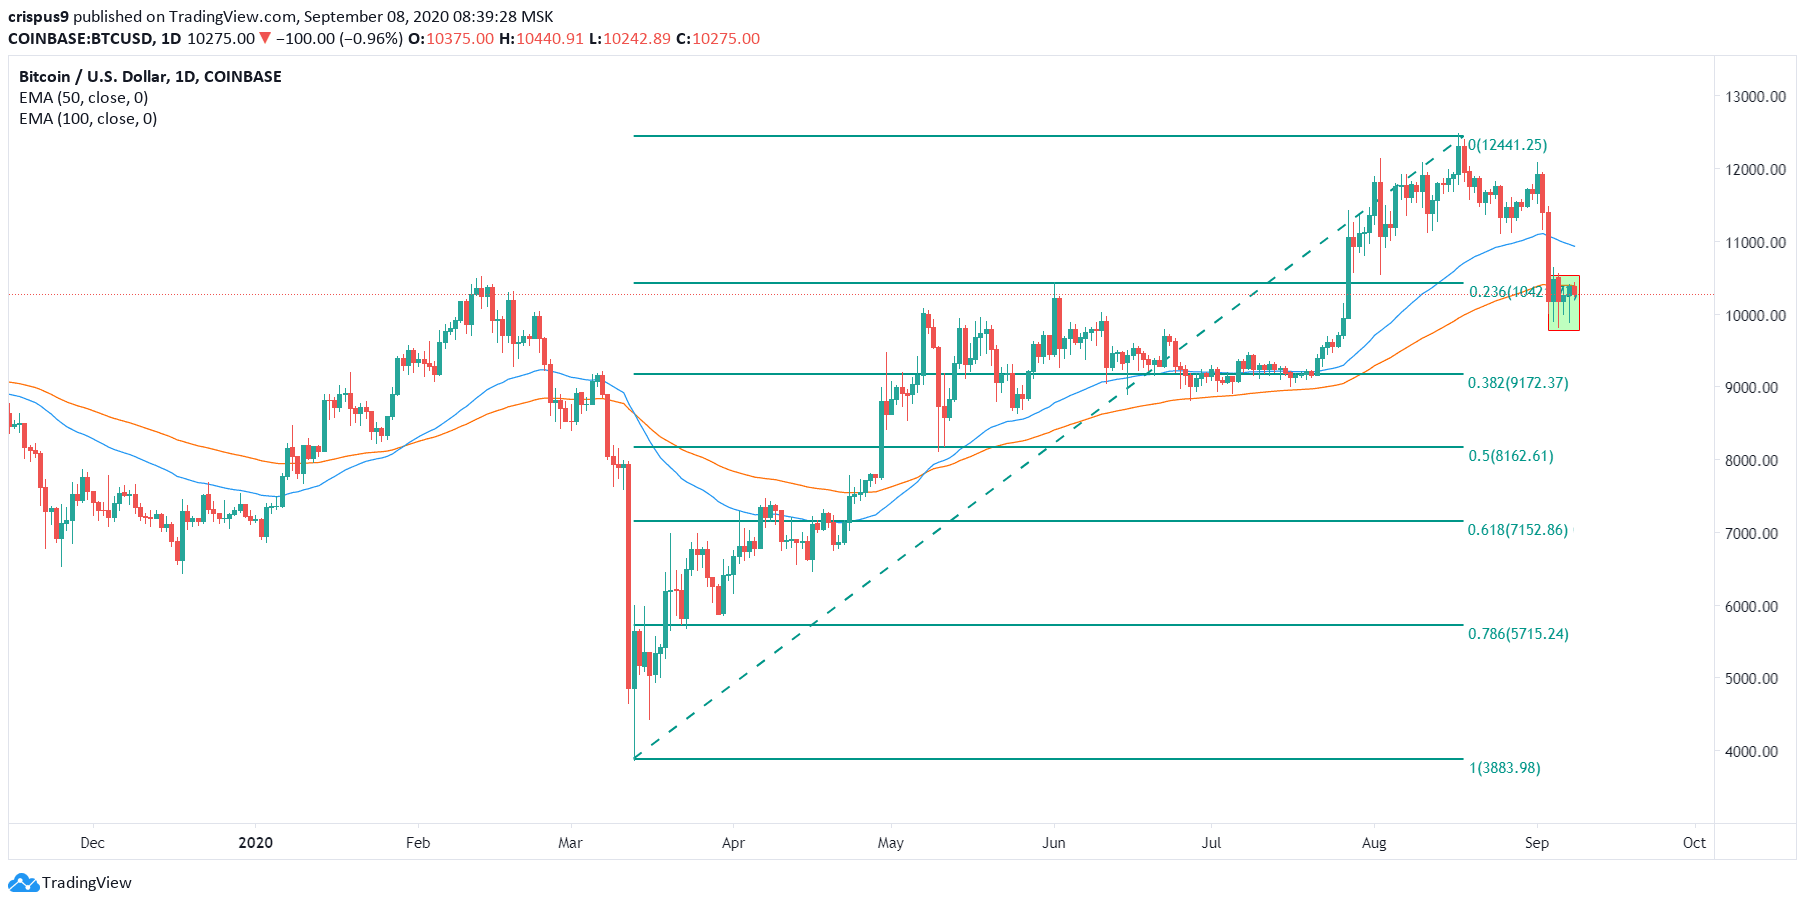
Looking at the daily chart, we see that the price has formed a bullish pennant pattern that is shown in green. As you can learn in our free trading course, this pattern is usually continuation in nature. In other words, the pattern happens because of indecision between bulls and bears.
As a result, in most cases, a bearish pennant tends to react by moving lower. It is also worth noting that Bitcoin price has moved below the 50-day and 100-day EMA and the 23.6% Fibonacci retracement level which is also usually a bearish pattern.
Don’t miss a beat! Follow us on Telegram and Twitter.
Bitcoin price daily chart
Bitcoin price lower timeframe hint at more downside
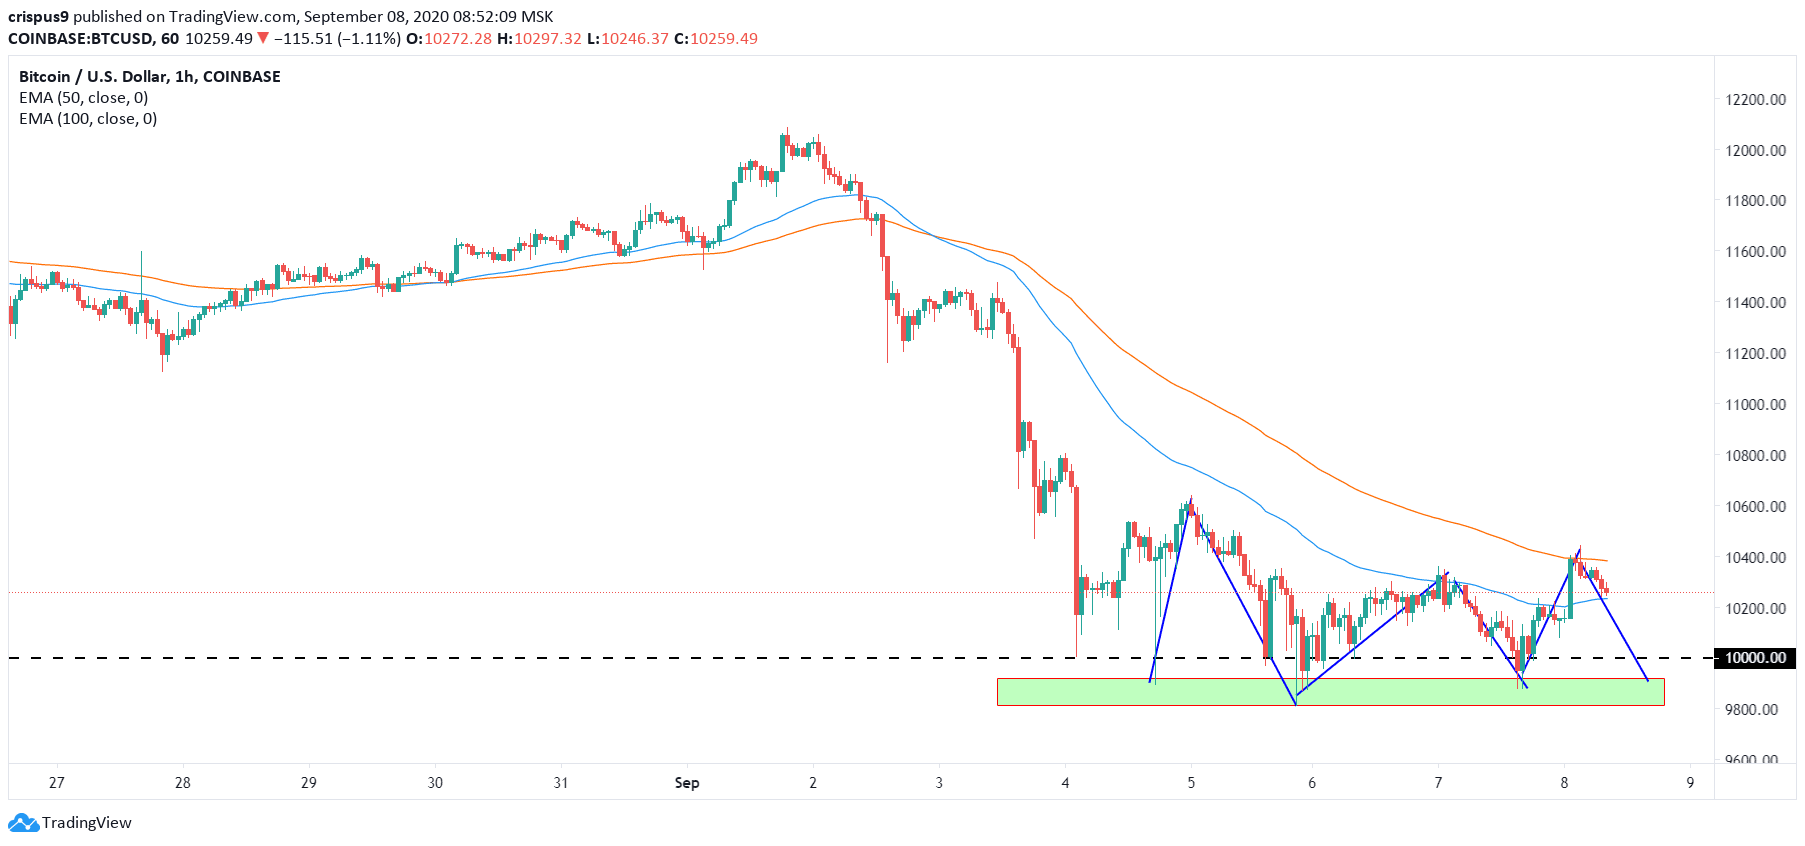
Meanwhile, a look at the hourly chart reveals something unique. As you can see, Bitcoin price dropped to a low of $9,887 last week. It then attempted to have a relief rally that ended at $10,645 and then dropped back to $9,775 and then rallied again. This time, it reversed at $10,335. As of this writing, the price is dropping, which means that the path of least resistance in the short term is lower. As such, it is possible that the price will continue falling, perhaps below $10,000.
BTCUSD hourly technical analysis
More content
- Download our latest quarterly market outlook for our longer-term trade ideas.
- Follow Crispus on Twitter.
- Do you enjoy reading our updates? Become a member today and access all restricted content. It is free to join.