



Archived Article This article was published more than 5 months ago. The market data, prices, forecasts, and analysis were accurate at the time of publication but may have changed since then. Please use this article for historical reference only and refer to our latest content for current market information.
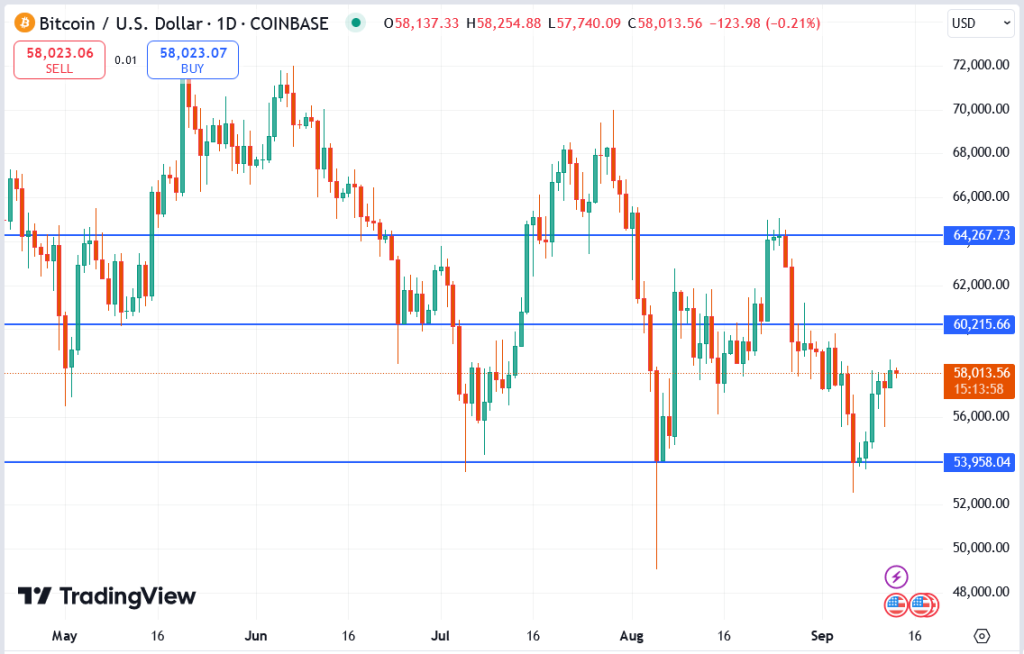
Bitcoin (BTC) is trading around $58,013 today, continuing its fluctuating price movements. After a sharp decline in late August, the price has entered a consolidating phase, with signs of a potential recovery soon.
Key Support and Resistance Levels
The chart indicates strong resistance at $60,215. Bitcoin struggled to break through this level during multiple attempts in the past few weeks, signalling that buyers will need significant momentum to push above it. A sustained break above this point could lead to a test of the next resistance at $64,267, a level seen in early June.

On the downside, Bitcoin finds support at $53,958. This level provided a crucial bounce in early September after BTC briefly dipped below $54,000. Any break below this support level could open the door to further downside toward $50,000.
Technical Indicators and Forecast
While Bitcoin has been consolidating between $56,000 and $58,000, the market sentiment appears cautious ahead of critical macroeconomic developments. Based on the chart, there is a period of consolidation before a potential breakout. Traders will closely watch for signs of volume increases, which could suggest whether BTC will break the $60,215 resistance or retest lower support levels.
In the short term, if Bitcoin can build enough bullish momentum, there is potential for a breakout toward the $64,267 resistance. However, a failure to maintain current support levels could trigger a move back to the $53,958 area.