


- If you have been following IBM this year, it has tested your patience so far. The stock was off about 19% after another record drop
A Blue Chip Trying to Win Back Trust
If you have been following IBM this year, it has tested your patience so far. The stock was off about 19% year to date as of Oct. 20 after another record drop, this time a 25.2% one-day fall on July 14.
The AI trade is behind much of the nervousness. Our piece asking whether an AI selloff could break the market’s back captures the mood. IBM may not be growing like other large-cap tech stocks. However, its dividend is a healthy 2.7 % and it trades at around 21 times trailing earnings of nearly $11.69 per share. Hence it is cheap for big cap tech. It was at $251 on October 21, up 3.94%, ahead of third-quarter results reported. Here is the chart.
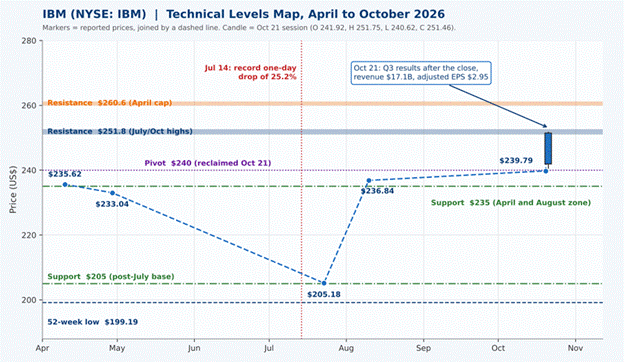
Chart note: markers are reported prices from market-data pages and the dashed line only joins them; it is not a tick-by-tick history. The October 21 candle uses the reported open, high, low and close.
Walking Through the Chart
April to October 2026 shows the blue theme and price axis from $188 – $280. Now, five blue markers connected by a dashed line to each other represent reported prices: $235.62 on April 10, $233.04 on April 29, $205.18 on July 23, $236.84 on August 10 and $239.79 October 20th Notice that the red vertical dotted line at July 14 marks the date of record drop. The stock came back up again to $236.84 for an 18day rise of 15.4% from $205.18
The right blue candle encompasses October 21: open $241.92, high $251.75, low $240.62, close $251.46 The long body combined with the little upper shadow tells us there were buyers who stuck around at the bell. The call-out box mentions a revenue of $17.1 billion and adjusted EPS of $2.95.

The horizontal lines aid you navigators. Near $251.8 is resistance at navy band that is the same as July and October highs. The April cap is the orange band around $260.6, with IBM reclaiming the pivot at $240 (purple dotted line). Green dash dot lines are support – $235 and $205, Navy dashed line is the 52-week low of US$199.19. This year has tried our patience with IBM, if you follow the tech giant at all. As of October 20, the stock was down at least 19% for the year following a record one-day decline of 25.2% on July 14. Most of the jitters due to the AI trade and our piece wondering if an AI crash could break the back of the market perfectly represents the mood. IBM, on the other hand, still yields 2.7%, and shares trade at about $11.69 per share trailing earnings — a modest valuation for large-cap tech of around 21 times. It finished October 21 at $251.46, a gain of 3.94%, before it was scheduled to report third-quarter results. Here is the chart.
Each month and each $20 shown with gridlines, and the deep drawdown from April to July is apparent in a glance at the chart.
What Could You Do Next?
The results were solid. Sales were up 8% on the software end, free-cash-flow guidance lifted and revenue growth outlook remained at 4% to 5%. Quotes in pre- and post-market were choppy but the price that will count come Thursday at open. Bulls retain control as long as $240 holds, with an additional target for a close above $251.8, which would put the first major test in sight at $260.6; almost 3.6% away from here. Should rejection happen, shares will fall back toward $240 and then to $235. Options traders priced 4.3% post-earnings move, so volatility is likely.
If you own IBM, the dividend and a beta of 0.72 may help you sit through noise. This is since it usually swings less than the broader market. For the potential buyers, please wait for at least a confirmed close above $251.8 or a calm pullback towards support first. Keep in mind that earnings reactions can take several sessions to fully settle. So, do not judge the entire move based on one print. Doing purchases over a few weeks spreads the risk of timing it wrong. Patience helps given that the 52-week high of $332.46 is still a distance from here.