The Chinese yuan eased against the US dollar after the latest PBoC interest rate decision and weak economic data. USD/CNY edged upwards to 6.785, the highest point since January 9. It also jumped after a series of hawkish statements by Fed officials who insisted that the bank would continue its aggressive monetary policy in the coming months.
The PBoC continued with its dovish tone on Friday when it decided to leave the prime rate unchanged at 3.65% where it has been in the past few months. It joined the Bank of Japan (BoJ), which has maintained a dovish tone by not hiking interest rates. Earlier this week, the BoJ surprised the market by leaving rates and the yield curve target intact.
The market is now focusing on the optimism of China’s reopening and the upcoming lunar new year. Most investors believe that the Chinese economy will start its recovery this year.
USD/CNY daily chart analysis
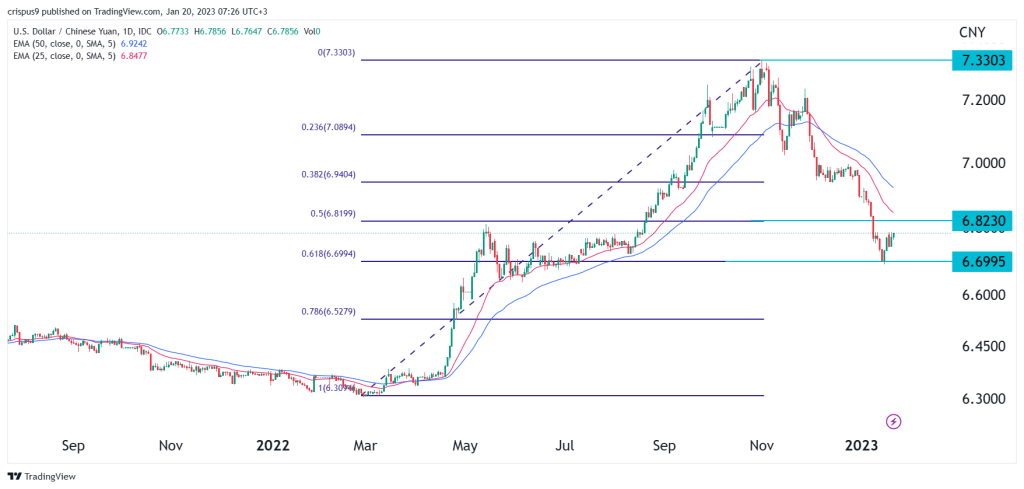
The recent Chinese yuan weakness was expected since it happened when the USD/CNY dropped to the 61.8% Fibonacci Retracement level. In technical analysis, an asset price tends to either pull back or consolidate when it hits such an important level of support. It is now a few points below the 50% Fibonacci retracement, which is also the highest point on May 12, 2022.
Despite the recent rebound, we see that the pair is in an overall bearish trajectory since it peaked at 7.33 on November 1. Most importantly, the exchange rate’s downward trend is being supported by the 50-period EMA.
Therefore, the 1D chart points to more USD to CNY gains in the near term as it seeks to retest the 50% retracement at 6.82. It will then resume the bearish trend and move below this year’s low of 6.70.
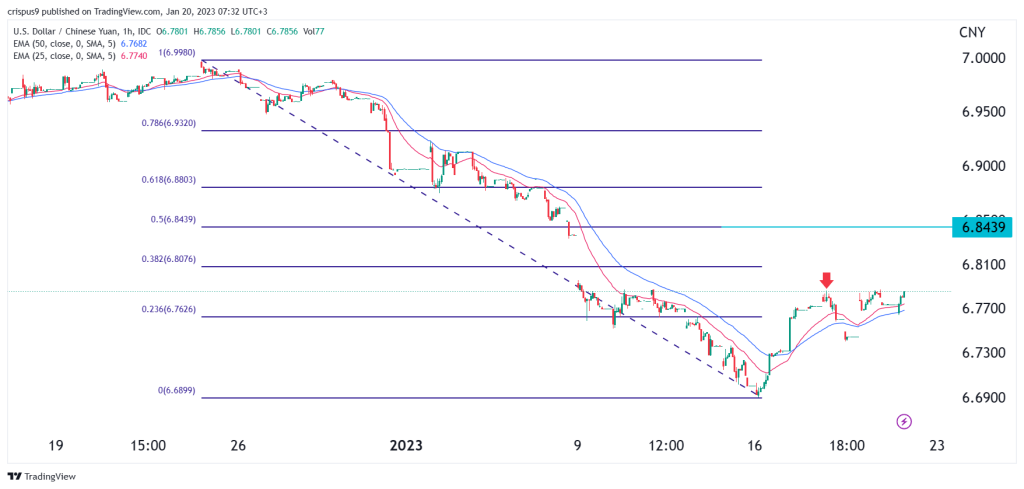
USD to CNY 1H chart analysis
The 1H chart is a bit different from the daily chart. As shown below, it has formed what looks slightly like an inverted Head and Shoulders (H&S) pattern. This pattern tends to be a good reversal sign. It has moved slightly above the 23.6% Fibonacci retracement and is about to move above the highest point this week.
The hourly chart seems supportive of the 1D view that the USD/CNY price has some more upside in the short term. Such a move will see it retest the 50% Fib point at 6.84, which is the same one on the 1D chart. The invalidation point of this trade will be at 6.7.