Retreating crude oil prices in the last few days leading up to yesterday have allowed the US Dollar to gain ground against the Norwegian Krone. However, today’s recovery has provided some strength in the Crown, allowing the greenback to pull back from weekly highs on the pair.
Crude oil prices recovered some of the lost ground since a decline to the lowest price levels in four months. As at the time of writing, crude oil price on the international benchmark Brent crude was trading 2.77% higher, logging in at $40.84 per barrel. It had hit as high as $41.18 intraday. This allowed the USDNOK to trade slightly lower from its highs for the week, coming in at 9.02180.
Technical Outlook for USDNOK
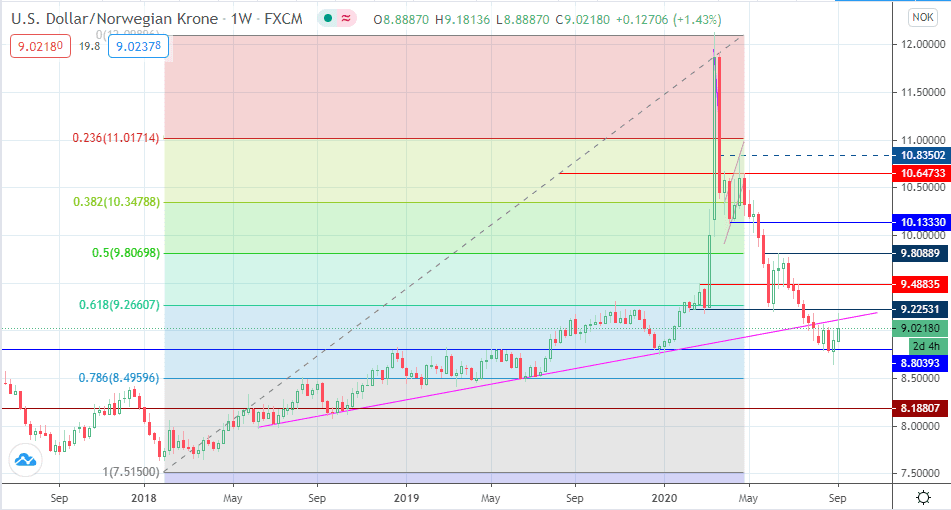
What we see on the USDNOK weekly chart is a beautiful technical play involving trendlines and support-resistance levels. The ascending support trendline that connected the July and October 2018 lows, as well as the July and December 2019 lows, has provided a basis for the play we see on the USDNOK right now. This trendline was broken last month when crude oil prices rose towards $45, giving strength on the Norwegian Krone even as the greenback witnessed bearish sentiment.
This move faltered last week as the greenback posted gains following Friday’s upbeat NFP data. This move continued on Tuesday and Wednesday, as the USDNOK bounced off support at 8.80393. However, the weekly candle has found resistance at the ascending trendline, causing a retreat off this week’s highs on the pair.
If the USDNOK breaks above the trendline, it could see immediate resistance at 9.22531. It would need to clear this area to be able to target 9.48835 and possibly 9.80889 (highs of the week ended 15 June 2020).
On the flip side, the rejection at the ascending trendline could provide the basis for a decline towards 8.80393. A breakdown of that level would then be required to target 8.49596 (78.6% Fibonacci retracement from the 29 January 2018 – 23 March 2020 swing move). 8.18807 lines up nicely below this level as additional support.
Don’t miss a beat! Follow us on Telegram and Twitter.
USDNOK Weekly Chart
More content
- Download our latest quarterly market outlook for our longer-term trade ideas.
- Follow Eno on Twitter.
- Do you enjoy reading our updates? Become a member today and access all restricted content. It is free to join.