
- The SBIN share price could be in for more selling as consumer inflation rises in the US and oil prices surge.
Current Setup and Live Chart
SBIN is the symbol of the State Bank of India, one of the top-listed stocks on the Nifty 50 index. The SBIN share price, like several other top names on the Nifty 50 index, has taken a hit this week amid renewed escalation in the US-Iran war. Ceasefire talks are said to currently be on “life support” after both sides failed to come to a compromise on several key issues. A renewed bombing campaign by the UAE, probably in retaliation for the earlier Iranian hits on its LNG trains, has ensured that oil prices have surged once more. The situation has put pressure on Indian equities, with the SBIN share price tumbling.
The SBIN share price continues to trade as a function of the oil shock risk premium. SBIN remains a macro-sensitive proxy for Indian financial stocks, which are highly sensitive to interest rate narratives. These narratives about interest rates have primarily resulted from the rise in energy prices. For a net energy importer such as India, higher energy prices exert a form of macro tax on the Indian economy and induce inflationary pressures, which could force the Reserve Bank of India to tighten monetary policy, with an attendant bearish impact on financial stocks. Near-term direction in the SBIN share price will be driven by the rates narrative, liquidity conditions, Rupee stress, and macro risks from rising energy prices.
A look at recent price charts indicates that the SBIN share price is now in the middle of resolving the double top pattern, with the bearish price action of the day now threatening the neckline support at 990.00. A breakdown of this neckline will have further ramifications for the stock, as it aligns with the current bearish macro narrative playing out in the markets.
Reuters news reports had earlier noted that the SBIN share price hit a record high after an earnings beat and an improved loan-growth outlook. The earnings results triggered several broker upgrades for the stock. The State Bank of India had also indicated that the geopolitical situation in the Middle East would not derail its expectations for FY credit growth and Net Interest Margin (NIM). However, it warned that loan demand could suffer if the conflict were prolonged. The stock is down 4.74% in Tuesday’s trading as of the time of writing.
SBIN Share Price Macro Drivers
1) Resilient Credit Growth Amid Macro Risks
The State Bank of India’s guidance for its loan growth and net interest margin (NIM) has been maintained at 13%–15% and ~3%, respectively for the full year. But the company has issued a caveat: a prolonged Middle East conflict will pose a risk, as it will dampen loan appetite and borrower confidence.
2) Tightening Liquidity
Reuters reports indicate that tax outflows and the RBI’s FX market interventions to protect the Rupee from disorderly depreciation have pushed the country’s banking system liquidity into deficit. This is now tightening liquidity within the system. For the financials, this could raise funding costs and push up money market rates. Ultimately, margins start to come under pressure if yields on borrowed funds are not repriced quickly enough.
3) FX/Rupee Management

The oil shock risk premium has put considerable pressure on the Rupee. As a currency under a managed float regime, the Rupee is subject to intervention by the Reserve Bank of India (RBI). The RBI’s liquidity and FX management tend to constrain operational FX positioning by banks.
Price Catalysts for the Week
Oil price and Rupee Stress (macro risk premium): This is the largest macro risk premium confronting Indian financial stocks. The Indian equities market has shown high sensitivity to shocks from the rising energy prices and the external balance dislocation. Current account deficits and high energy prices are putting the Rupee under pressure, leading to a broader risk-off sentiment that is seeing the big names get sold off. Furthermore, tightening liquidity conditions can squeeze the margins of the big banks.
Liquidity Squeeze: The RBI’s market operations to contain any disordered weakening of the Rupee will include several liquidity support operations that include but are not limited to FX interventions of various types. This can tighten short-end conditions, which can cause margin compression of the financials stocks.
SBI’s guidance follow-through: Presently, the market is more sensitive to the oil shock risk premium than the positive guidance on loans and net interest margin. The latter is seen as supportive to the SBIN share price, but this pales in significance when compared with the current macro risks from the geopolitical situation.
SBIN Share Price: Forecast Scenarios
Base case: price to remain in a choppy consolidation with a cautious bias. The stock is likely to trade in a two-way street, with buyers stepping in on dips amid confidence in the positive credit growth guidance. However, the oil shock will keep any rallies capped.
Bull case: A re-rating could lead to a bounce that sends the stock to new highs. The trigger is a cooling of oil prices and easing of liquidity stress, which allows the market to focus on the positive guidance and credit resilience story.
Bear case: the bear case scenario will see a further selloff in the stock, triggered by a prolonged geopolitical situation in the Middle East. The oil shock keeps energy prices higher, which fuels broader risk-off sentiment and a selloff in Indian stock markets. As foreign portfolio funds leave, they convert their Rupee holdings into US Dollars, further weakening the Rupee. This ultimately leads to a de-risking of financial stocks in the market.
SBIN Share Price: Technical Outlook
Following the double tops formed at the 100% and 61.8% Fibonacci extension levels of the 23 October 2023 – 22 July 2024 upswing, the neckline at 990.00 is now vulnerable. If the breakdown attempt succeeds with a 1% closing penetration below this neckline support, the 896.85 pivot formed by the prior high of 22 July 2024 comes into the mix as the next downside target. However, the end-point of the pattern’s measured move is at the 839.65 price mark, the prior highs of April-August 2025. Below this mark, a further decline targets the 768.1 support.
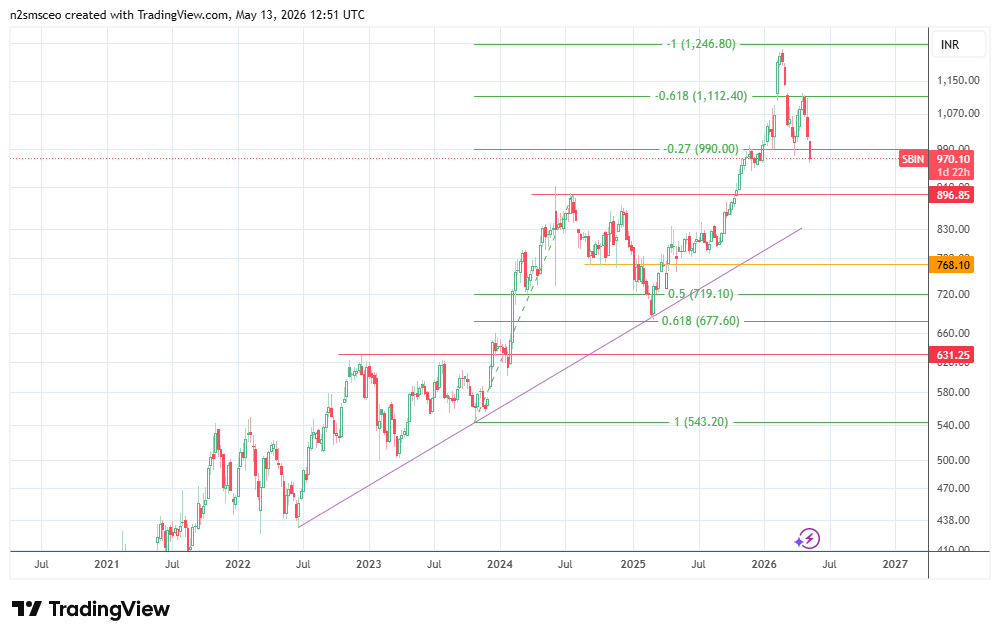
On the flip side, the bulls need to uncap the 1112 resistance and the lower of the two tops to create a pathway towards reclaiming the 1246 resistance. If this level is uncapped, new highs beckon at the 1464.20 resistance mark formed by the 161.8% Fibonacci extension level.
