
The NZDUSD erased some of the gains made in the past four days as traders digested the latest decision by the Federal Reserve. The pair also reacted to news that the New Zealand economy moved into its first technical recession since the past global financial crisis. It is trading at 0.6691, which is its lowest level since Tuesday last week.
In a statement earlier today, the New Zealand Statistics bureau said that the country’s economy contracted by more 12.2% in the second quarter. That was better than the 12.8% decline that analysts polled by Reuters were expecting. The economy declined by 12.4% on an annualised basis.
The decline was mostly because of the policy measures that the government put in place to curb the spread of the virus. These measures included mandatory stay-at-home orders and mass testing that have helped make the country one of the best managed in the world. It has confirmed less than 1,900 cases and just 25 deaths. That is in contrast to other countries that have reported thousands of cases.
According to the bureau, all sectors, including manufacturing, trade, tourism, and other services reported a decline in activity. However, the decline was partially offset by the fact that agriculture is the dominant sector in the country. Because people have to eat, the sector tends to be relatively stable in times of crisis.
The main reason why the NZDUSD has declined is the Fed decision that led to an overall strong dollar. The bank left rates unchanged and signalled that the rates will remain at this level until 2023. Subsequently, the dollar index, which measures the performance of the currency against other currencies rose by more than 0.45% in overnight trading.
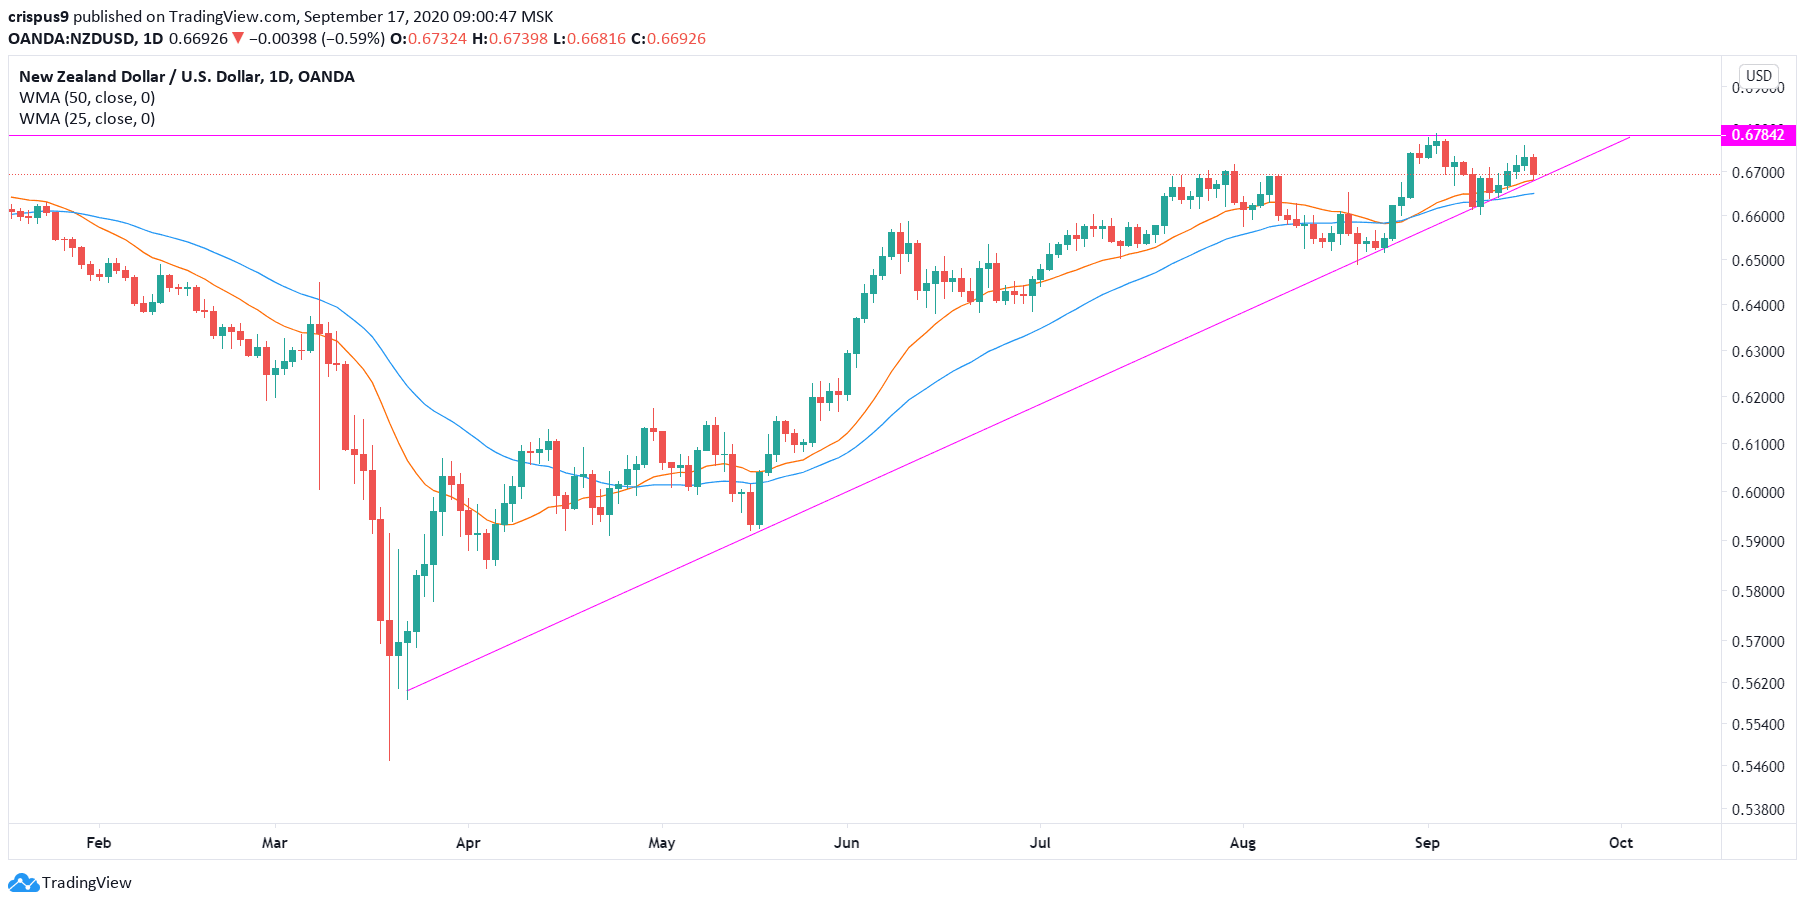
NZDUSD technical outlook
The daily chart shows that the NZDUSD is eerily similar to the AUDUSD that I covered a while ago. The price is above the 50-day and 100-day weighted moving averages. It is also forming an ascending triangle pattern, that is shown in pink. This upper side of the triangle is at 0.7785, which is the highest level on September 1. The ascending trendline connects the lowest levels on March 23, May 18, August 20th, and in September. This means that the trend remains being bullish so long as the price is above that trendline.
Start your trading journey with our free forex trading course and one-on-one coaching by traders and analysts with decades of experience in the industry.
Don’t miss a beat! Follow us on Telegram and Twitter.
NZDUSD technical chart
More content
- Download our latest quarterly market outlook for our longer-term trade ideas.
- Follow Crispus on Twitter.
- Do you enjoy reading our updates? Become a member today and access all restricted content. It is free to join.