Litecoin has been steadily declining since January 18, losing 28 per cent of its value since then.
The latest bearish move comes amidst a slump in Bitcoin, a positively correlated cryptocurrency with Litecoin. On the other hand, Bitcoin is driven lower by a tighter US monetary policy aimed to reign in the soaring US inflation.
Today, the Federal Reserve is expected to commit to a March rate hike at their FOMC meeting. Danske Bank analysts even expect the Fed to introduce quantitative tightening in September 2022.
Quantitative tightening means that the quantitative easing implemented at the start of the coronavirus pandemic would be unwound. If Danske Bank is correct in their assessment, then the moves of the Fed would be highly unusual. Ordinarily, central banks reduce their QE program, followed by increases in interest rates, followed by Quantitative tightening. This process tends to take years, but it looks like the Fed is aiming to do this within 12 months.
Interestingly, the Fed did not expect to be so aggressive to normalize their monetary policy just a few months ago. Also, most investment banks did not expect the Fed to be this bold. But now, both the Fed and the investment banks are ultra-hawkish, with the CEO of JPMorgan expecting up to 7 rate hikes in 2022.
Could the Fed and the markets also be wrong in how aggressive the monetary policy should be normalized? If they are, it could boost cryptocurrency markets; hence, today’s Fed rate meeting will be extra crucial for Litcoin and Bitcoin holders.
Litecoin Price Prediction
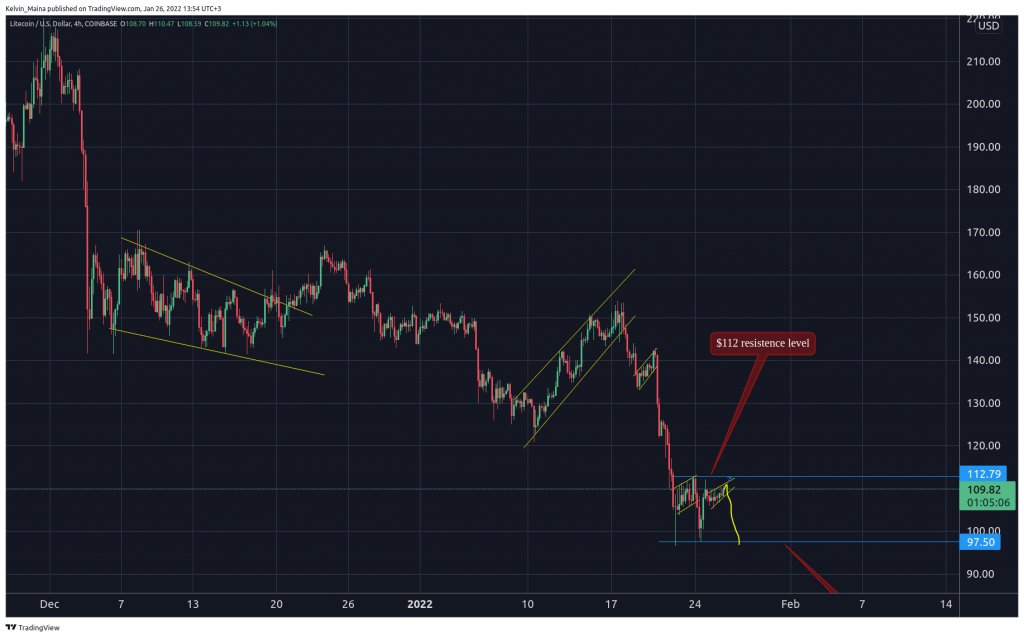
The 1-hour chart provides a few perspectives of where LTCUSDT may be heading next. This is because the crypto has been trading within an ascending channel as the price is sandwiched between support and resistance levels.
Yesterday, LTCUSD tested both the upper and lower trendline of the ascending channel without a breakout.
Currently, the prices have tested the lower trendline and bounced back. This is an indication of a possible retest of the upper trendline, which will either trigger a breakout to the upside or a continuation of the ascending channel.
If a breakout is triggered, I expect the prices to retest the resistance level of $112 and then start another downward trend. If the price trades above $112, it will signal an LTCUSD reversal and the start of a bullish move.
My second perspective of the 1-hour chart is that a breakout will not get triggered once prices hit the upper trendline. Instead, the prices will aggressively move to the downside, triggering a breakout from channel from the lower trendline.
When this happens, I expect the prices to aggressively move to the downside in a significant bearish trend and reach the $97 support level.
Therefore, my long-term general perspective on this crypto is a downward move that will hit the $97. This is regardless of the breakout method the prices use to get out of their current ascending channel structure.
LTCUSD Chart